Wildfire risk in California: how to check your property exposure in 2026
California's 2025 fire season destroyed more than 18,000 structures in
the Palisades and Eaton fires alone. This page explains how wildfire
risk is calculated across the state, which counties carry the highest
exposure, and what every property owner should check before insurance
renewal.
Source: NASA Earth Observatory image by Joshua Stevens, Landsat 8 (Operational Land Imager), November 8, 2018 — Camp Fire, Butte County, California. Via
Wikimedia Commons
(public domain).
Coverage map
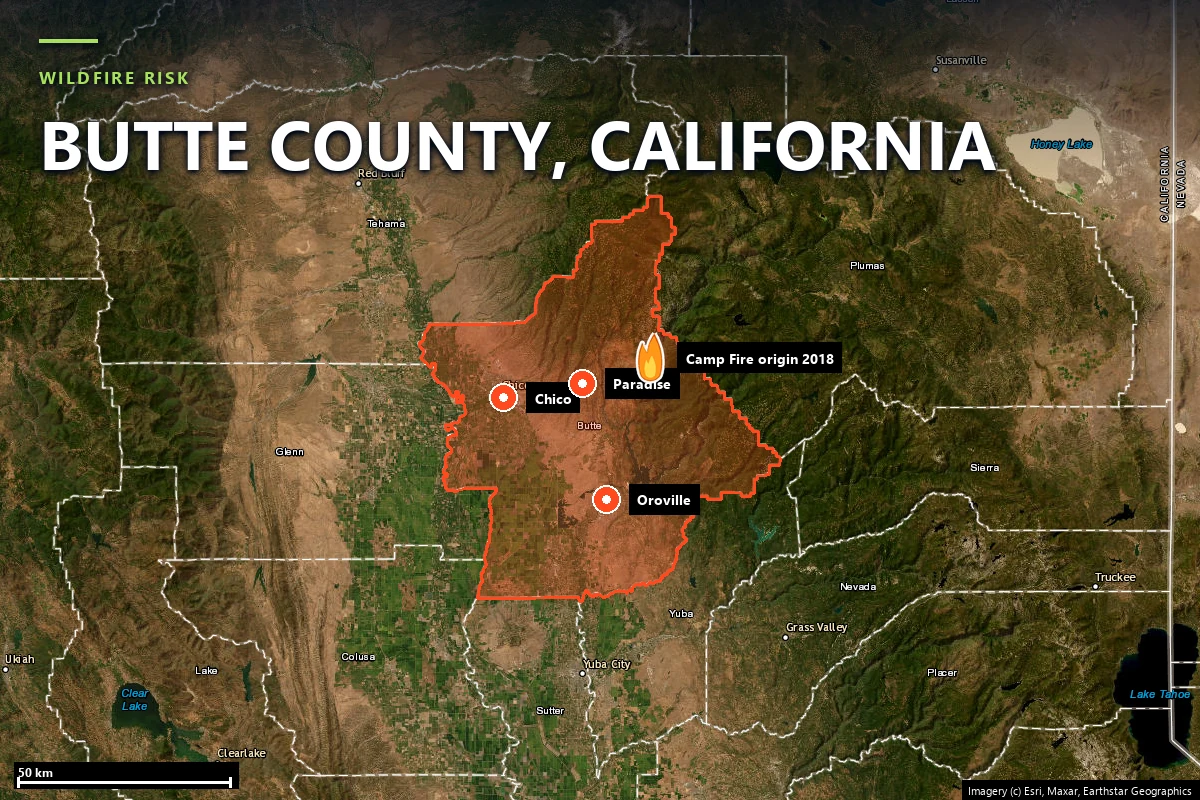
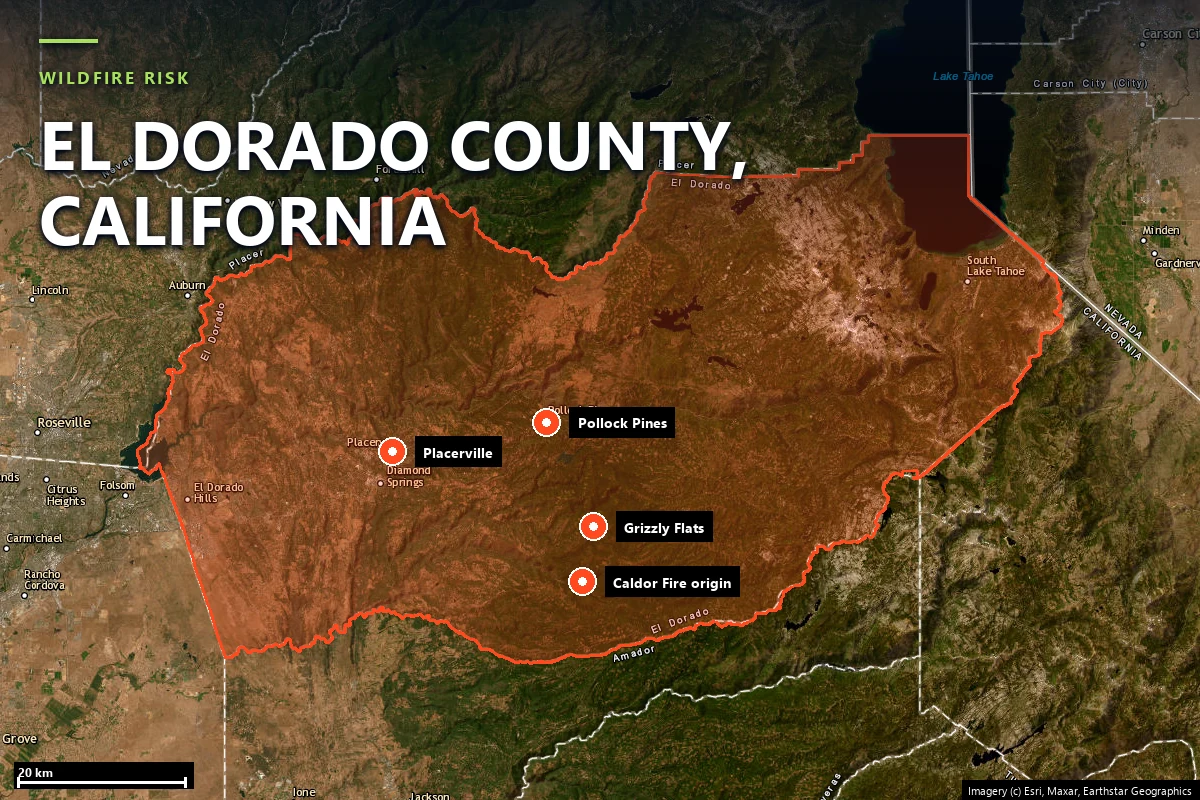
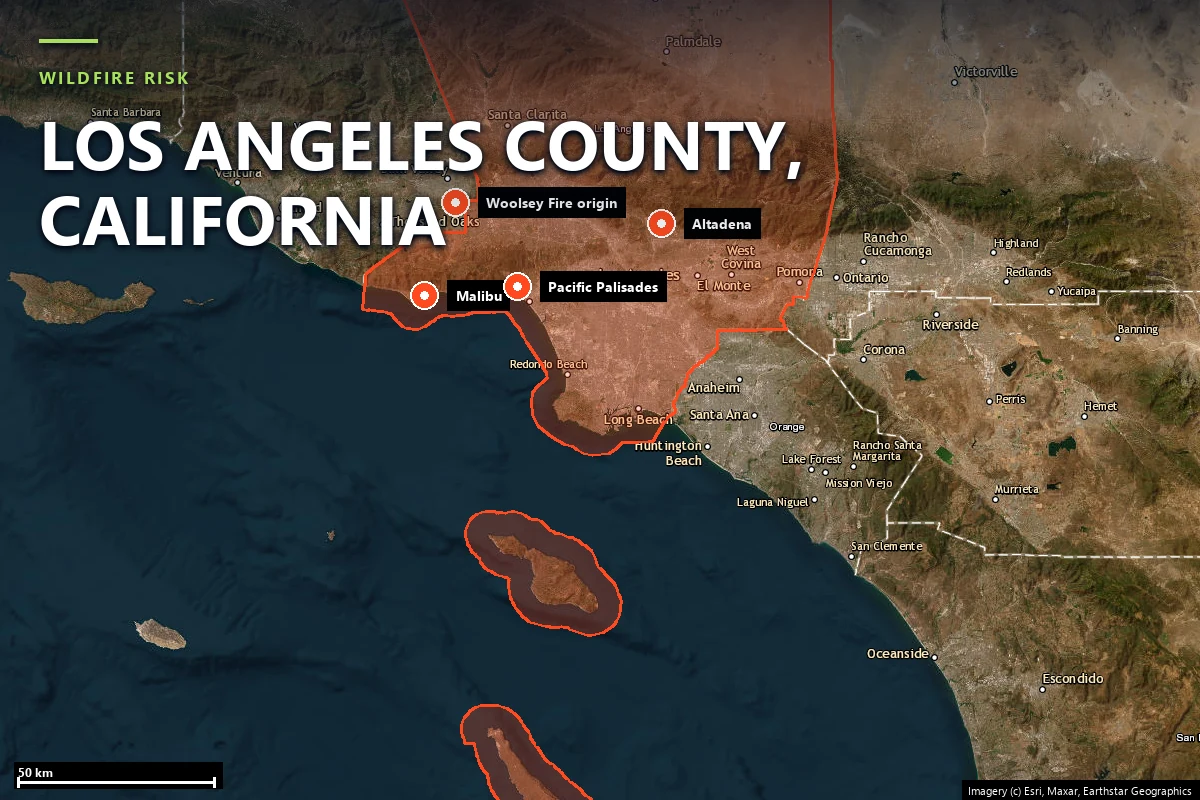
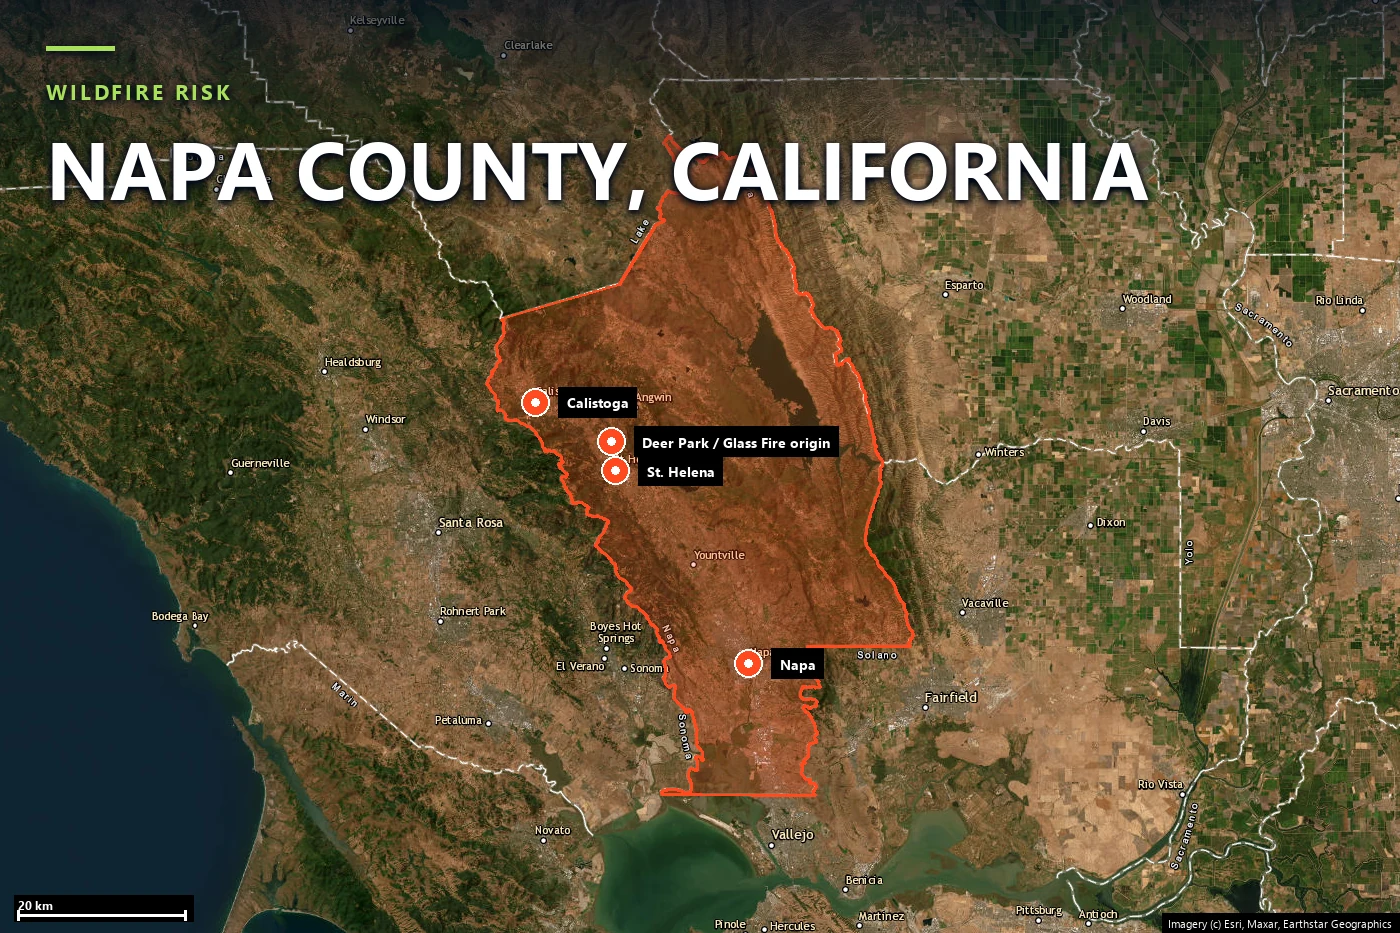
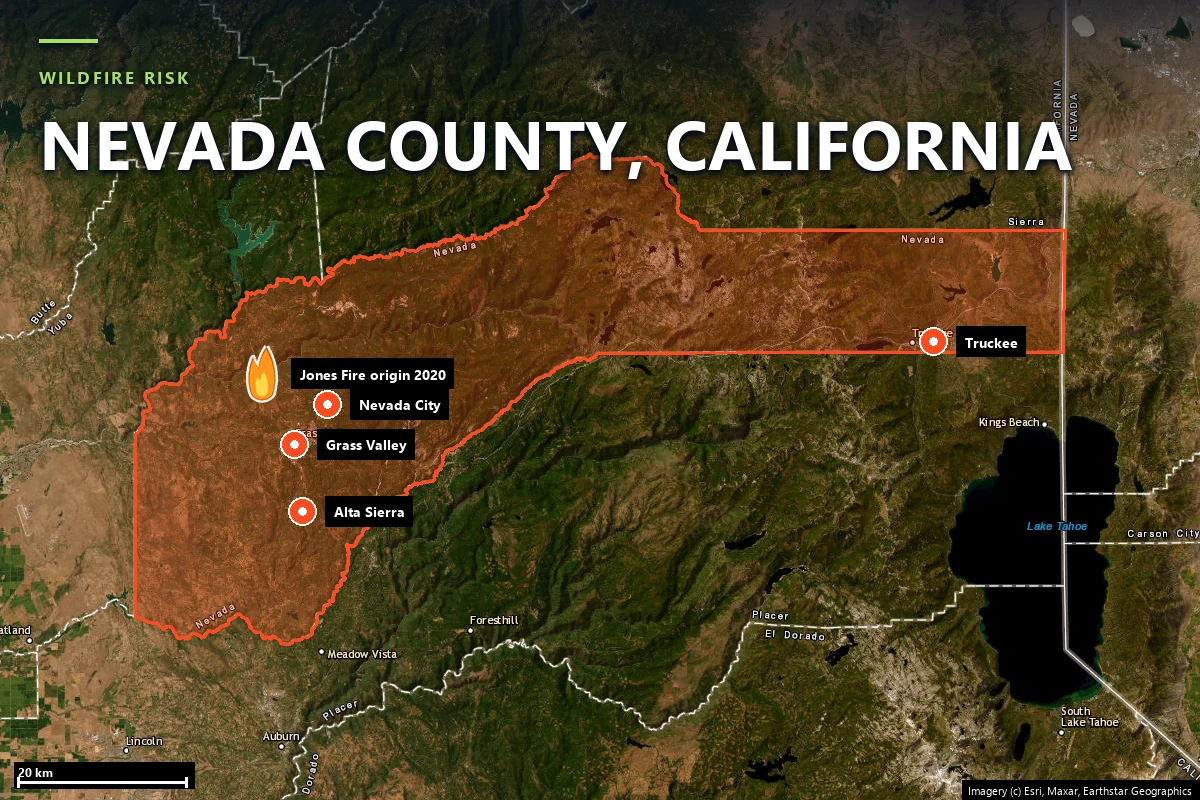
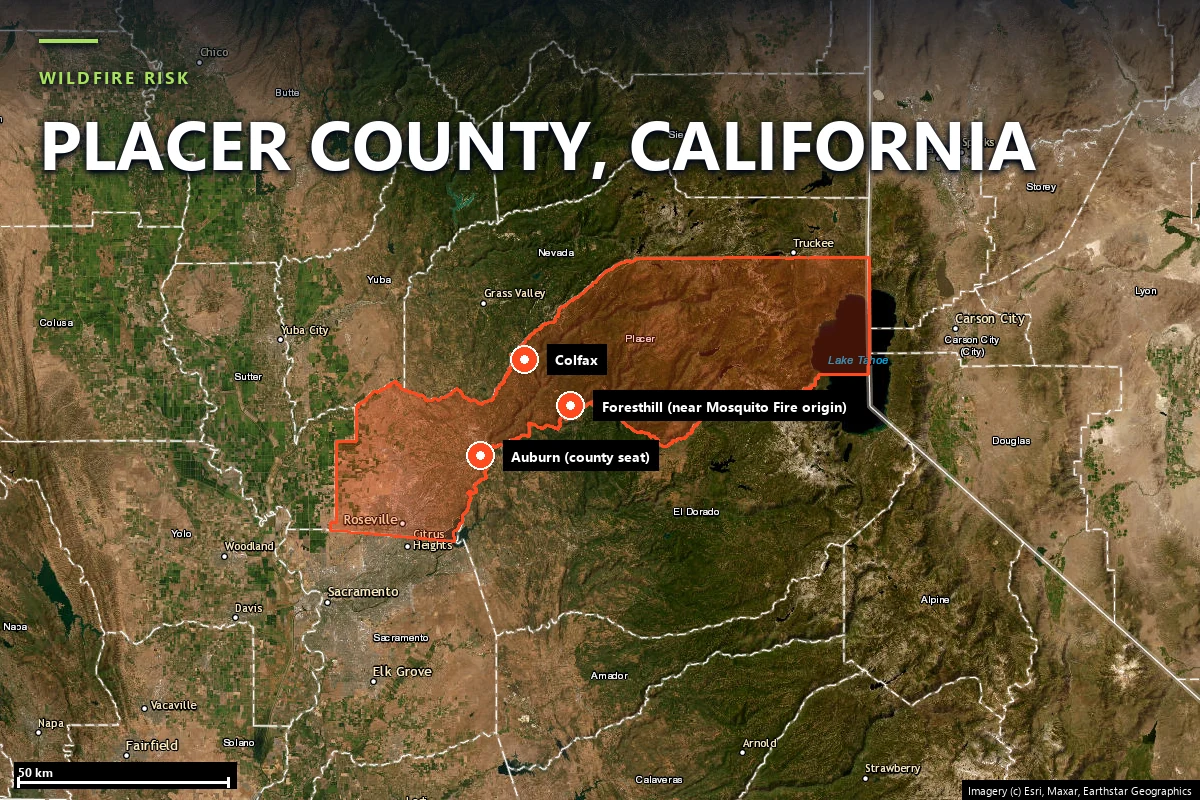
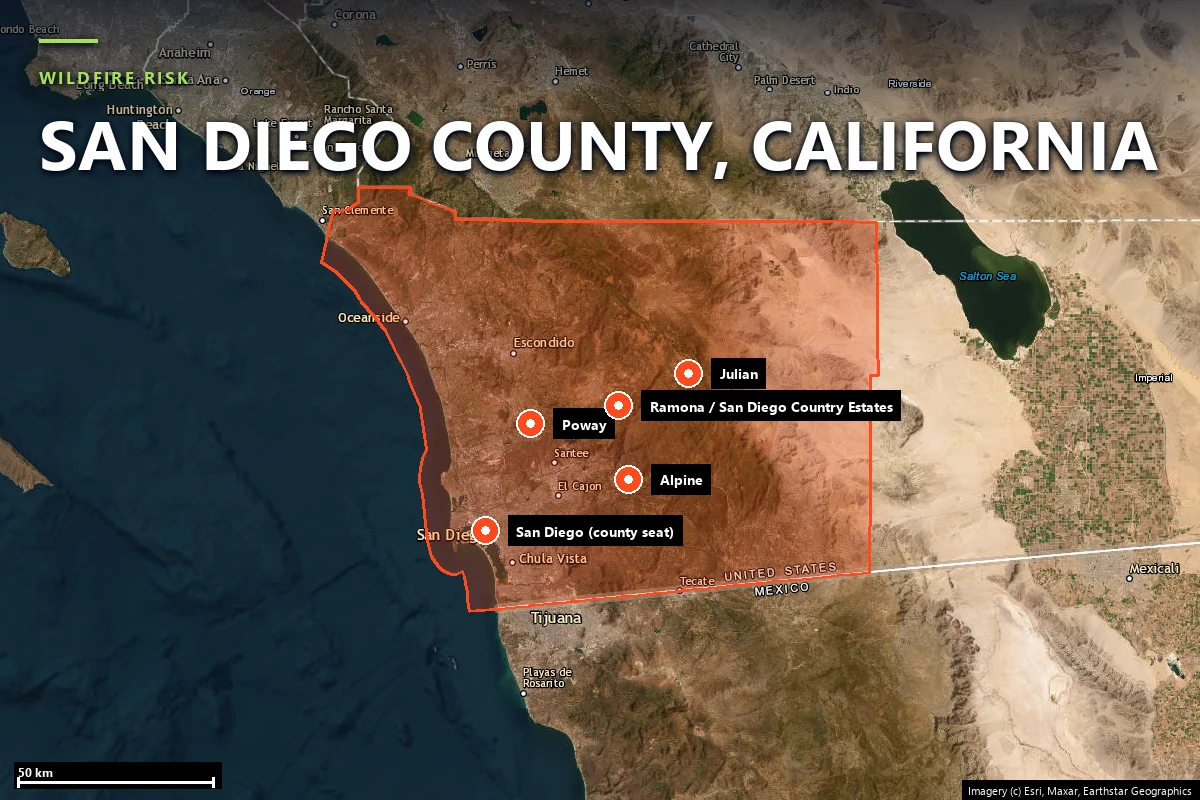
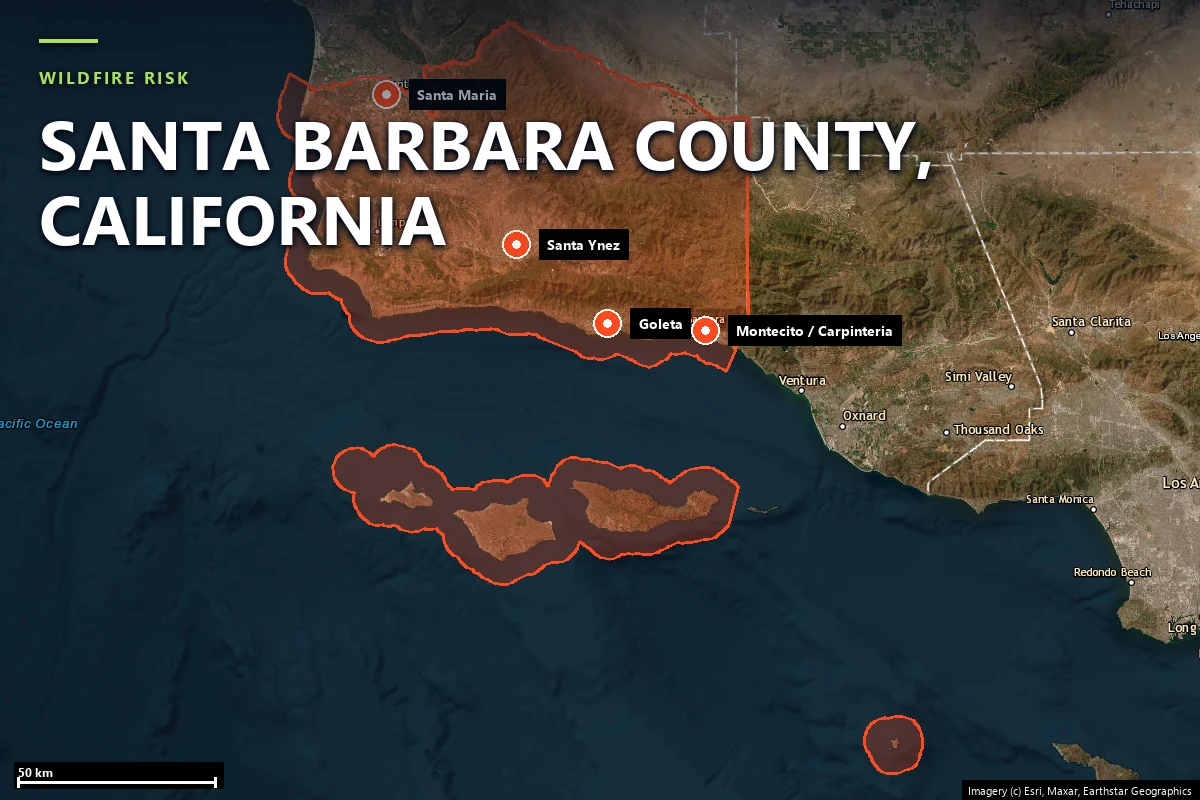
California counties we have analyzed
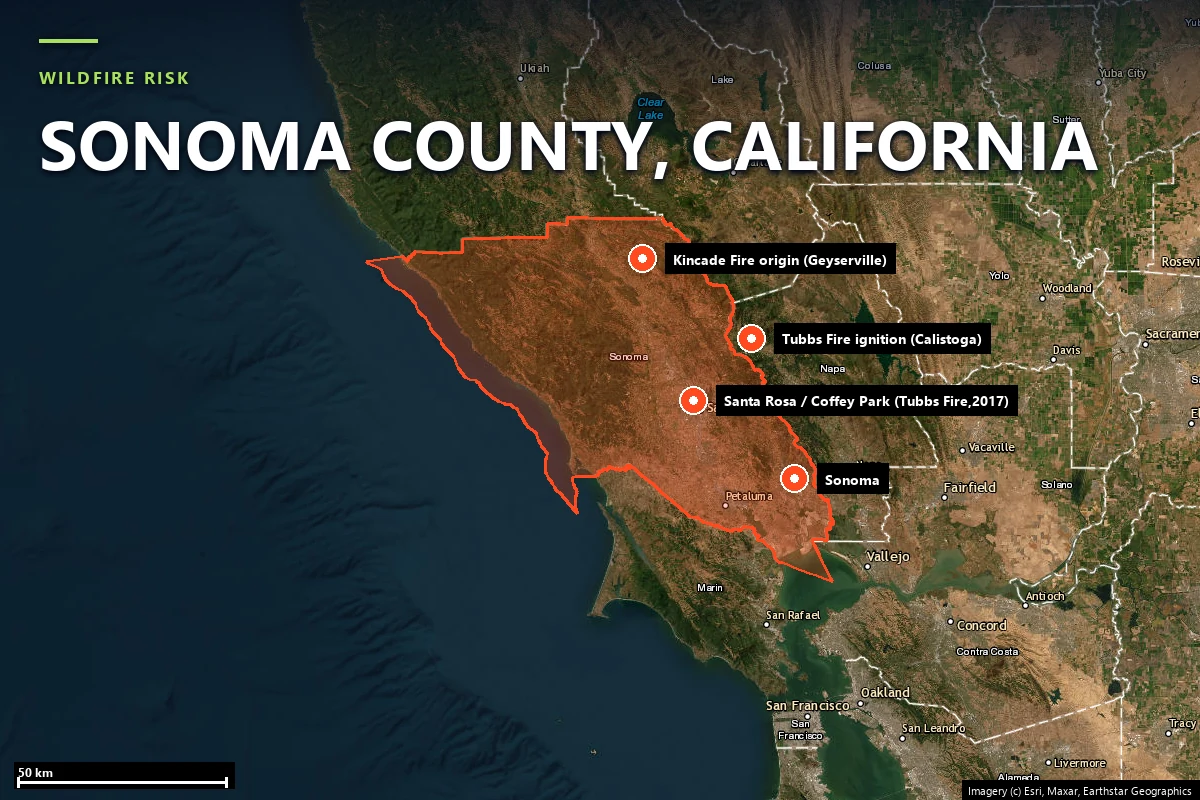
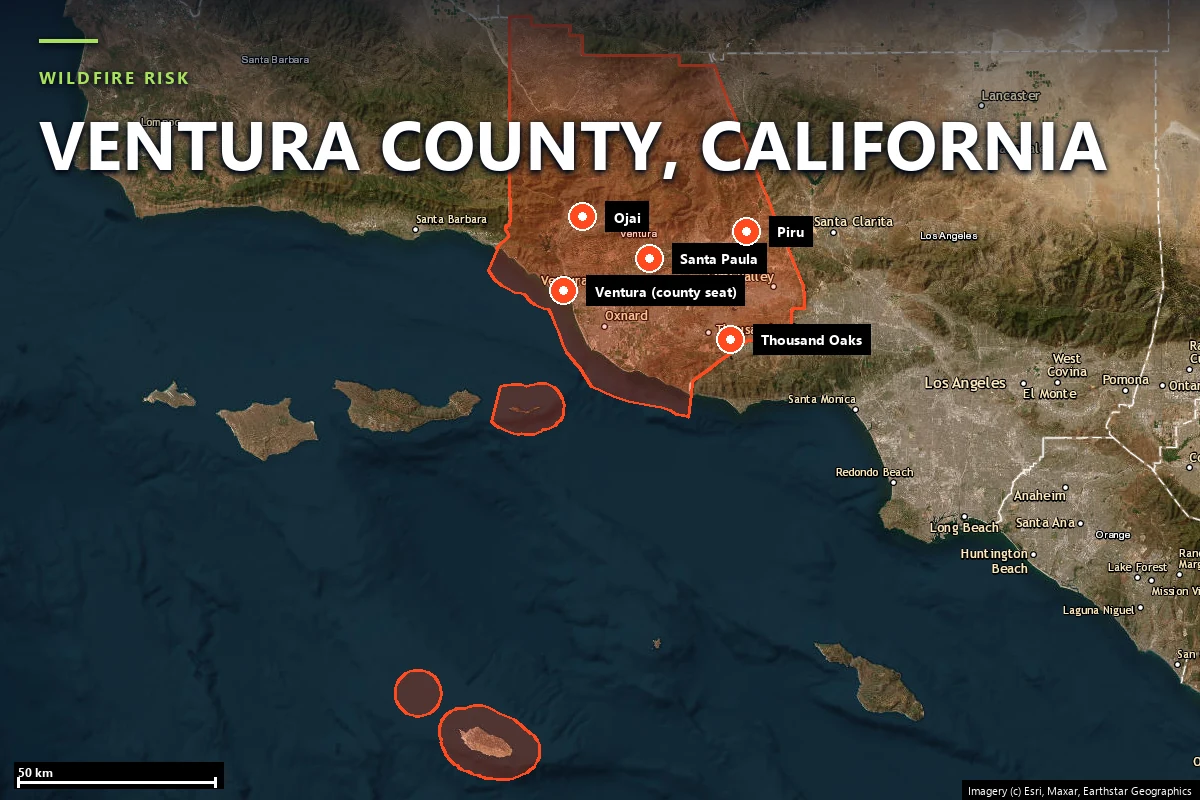
Highlighted counties have a published, data-backed page built on real Satelife reports for an address and a community inside them. Select one to open it. Satelife runs address-level reports statewide — the highlight marks where we have published the research, not where we can score.
Select a highlighted county to open its report page.
The Palisades and Eaton fires (January 2025) destroyed more than 18,000 structures across Los Angeles County — the most destructive January fires in California history. They follow the 2018 Camp Fire (153,336 acres, Butte County, 85 fatalities) and the 2017 Tubbs Fire (Sonoma County, 5,636 structures).
Statewide, acreage burned and structures lost trended sharply upward between 2017 and 2025, driven by drought cycles and Wildland-Urban Interface expansion. The peak risk window runs late May through November, with the most destructive events typically falling between August and October.
The CAL FIRE Fire Hazard Severity Zone (FHSZ) framework classifies land as Moderate, High, or Very High — and is the basis for both building-code requirements and insurer underwriting decisions.
Sources: CAL FIRE Incident Archive · USGS · NIFC annual reports.
Terrain & vegetation
Why some California properties burn and others don't
Three vegetation types dominate California fire risk: chaparral (Southern California foothills), oak woodland (Central Coast and Sierra foothills), and mixed conifer (Sierra Nevada and Klamath ranges). Each has a different fuel-moisture cycle and flame length under fire weather.
Terrain drives ignition probability and spread rate. South-facing slopes dry out faster, steep slopes accelerate fire run, and Wildland-Urban Interface boundaries — where structures meet wildland fuels — are where most structure loss happens. Add Santa Ana winds (Southern California) or Diablo winds (Bay Area), and the same terrain becomes a different risk profile within hours.
Insurance
What California wildfire risk means for your insurance
California FAIR Plan policies surpassed 400,000 in 2024 — roughly 100% increase versus 2020, and approximately 20× the population the plan was designed for. State Farm non-renewed about 72,000 California policies in 2023; Allstate, Farmers, and AIG imposed similar restrictions.
SB 1060 (in force 2025) requires carriers to offer premium discounts for verified mitigation, turning a property-level wildfire report from a discretionary purchase into documentation with direct financial consequences. For carrier-by-carrier rules, FAIR Plan coverage details, and the SB 1060 discount path, see California wildfire insurance.
California's insurance crisis is no longer about whether your ZIP code is risky. It is about whether you can prove, at the property level, that yours is the mitigated house on the street.
Sources: California Department of Insurance (CDI) Annual Reports · SB 1060 text.
Real estate
How wildfire risk affects California property value
California Civil Code §1103 already requires sellers to disclose Natural Hazard zones at the point of sale. As insurance availability tightens, fire-zone status increasingly becomes a closing-risk variable rather than a paperwork item — buyers who cannot bind insurance cannot close.
Investors evaluating California fire-zone properties face three real options: walk away, negotiate price for the insurance gap and mitigation cost, or buy and mitigate to qualify for the SB 1060 rebate path. The third path — when documented through a Satelife report — converts mitigation cost into a measurable insurance benefit.
What a buyer, seller, or lender sees in the report
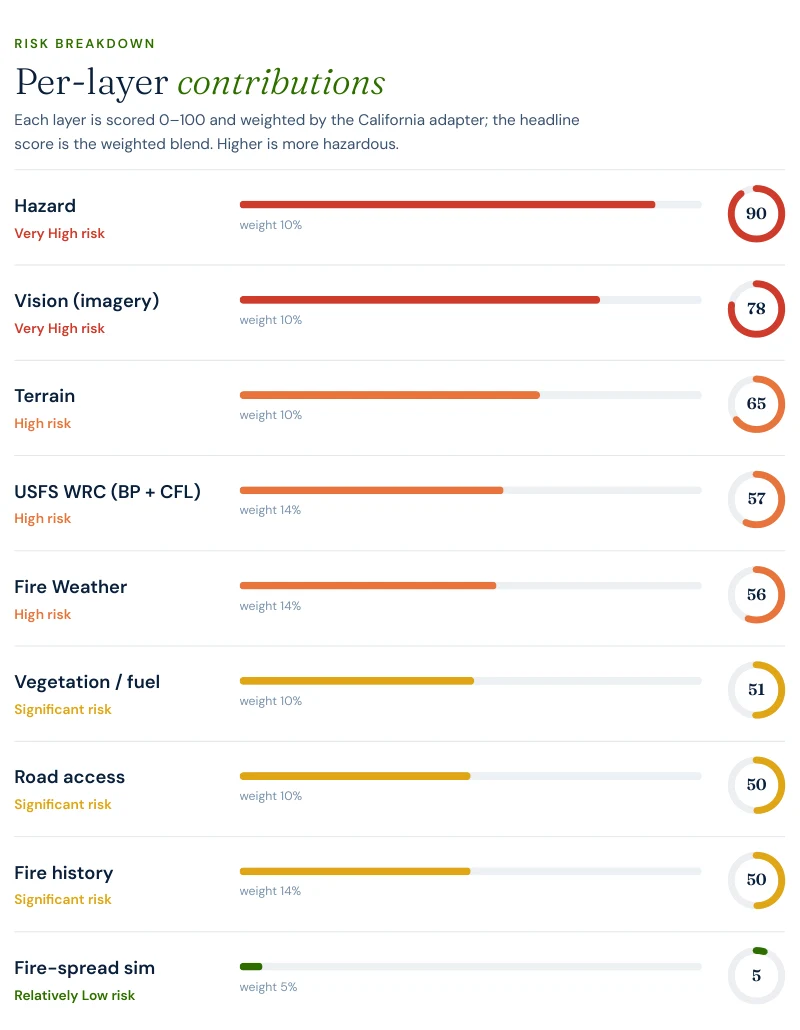
The same composite score (0–100) and eight-layer breakdown —
hazard zone, AI vision read of the parcel, terrain, fire
weather, vegetation/fuel, road access, fire history, and
fire-spread simulation — becomes the page a listing agent
attaches to a disclosure packet, or a buyer hands their
insurance broker before writing an offer contingent on
coverage.
Report excerpt — per-layer contributions from
a real Satelife Wildfire Risk Report (El Dorado County, CA,
July 2026).
Get your California property report →
Risk reduction
What California homeowners should do this season
CAL FIRE's defensible-space framework defines three zones: Zone 0 (0–5 ft, ember-resistant zone, no combustibles), Zone 1 (5–30 ft, lean-clean-green), and Zone 2 (30–100 ft, reduced fuel zone). Each zone has specific maintenance requirements; documented compliance is what underwriters and the SB 1060 mitigation discount process accept as evidence.
Annual review is the rule, not the exception. Vegetation grows back, weather changes, and home-hardening choices (vents, eaves, roofing) interact with the surrounding fuel bed. A property that passed defensible-space inspection in 2024 is not necessarily compliant in 2026.
Frequently asked questions about California wildfire risk
Is my house in a fire zone in California?
Start with the CAL FIRE Fire Hazard Severity Zone (FHSZ) viewer using your address. The viewer returns Moderate, High, or Very High classifications. For a property-level risk score that incorporates terrain, vegetation, fire history, and home-hardening signals — not just the FHSZ band — run a Satelife address-level report.
How is California wildfire risk calculated?
Satelife combines CAL FIRE FHSZ designations, USGS terrain and vegetation layers, NOAA fire-weather data, and First Street exposure modeling into a single property-level risk score. The full data-source list and weighting logic are documented on the methodology page.
Which California counties have the highest wildfire risk in 2026?
Los Angeles, San Diego, Sonoma, Napa, El Dorado, and Placer carry the largest combination of high-VHFHSZ acreage, structure density at the WUI, and post-2017 loss totals.
Does FAIR Plan cover my California home?
California FAIR Plan is the insurer of last resort and is available statewide. It covers basic fire perils with specific policy limits and surcharges, and is generally more expensive than admitted-market coverage.
Can I lower my California wildfire insurance premium?
Yes — under SB 1060, in force since 2025, California carriers must offer premium discounts for verified wildfire mitigation. A Satelife mitigation report documents which actions you completed and is structured to be accepted in the carrier discount workflow.
Get your California wildfire risk report
PDF + property-level risk score + mitigation action plan you can hand to your insurance broker. Address-level, not ZIP-level.