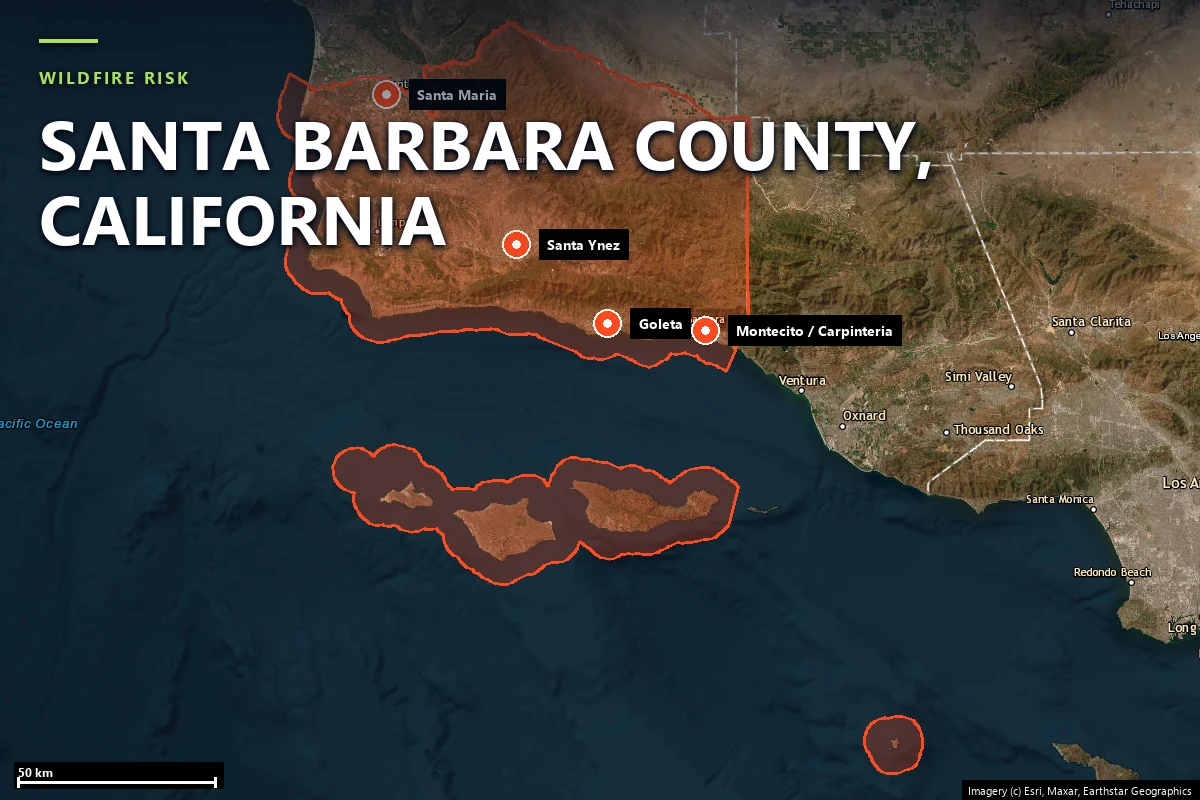
Wildfire risk in Santa Barbara County: where the fire ends and the burn scar takes over
The 2017 Thomas Fire burned into the Santa Ynez foothills above Montecito;
a month later, on January 9, 2018, a burst of rain on that burn scar unleashed
debris flows that killed 23 people and destroyed 65 homes. A current Satelife
property report for an East Mountain Drive address in Montecito reads 55.1/100,
High tier, and names the Thomas, Jesusita, Tea, and Coyote fires directly. This
page maps Santa Barbara County's wildfire risk with satellite data and two real
Satelife reports run from inside Montecito in July 2026.
Sundowner winds, a steep front range, and a coast built right against it
Santa Barbara County runs from the Pacific coast up the abrupt south face of the Santa Ynez
Mountains and back across the San Rafael range and the Los Padres backcountry. The county's
structural wildfire risk sits on that south-coast strip — Montecito, the Santa Barbara
Riviera, Mission Canyon, Carpinteria, Goleta — where dense residential development presses
right up against steep chaparral slopes. The record is long and severe:
Thomas Fire (December 2017) — 281,893 acres across Ventura and Santa Barbara counties. It burned into the foothills above Montecito and Carpinteria, and its burn scar produced the January 2018 debris flow.
Montecito debris flow (January 9, 2018) — roughly half an inch of rain in five minutes on the fresh Thomas burn scar sent debris flows through Montecito, killing 23 people, destroying 65 homes and damaging more than 460. The clearest case in the state of a wildfire's risk outliving the fire itself.
Jesusita Fire (May 2009) — 8,733 acres and 80 homes in Mission Canyon and San Roque, driven by sundowner winds; some 35,000 people evacuated. The Tea Fire (November 2008) destroyed roughly 210 homes on the Montecito–Riviera edge months earlier, and the Zaca Fire (2007) burned 240,207 acres in the backcountry — California's second-largest fire at the time.
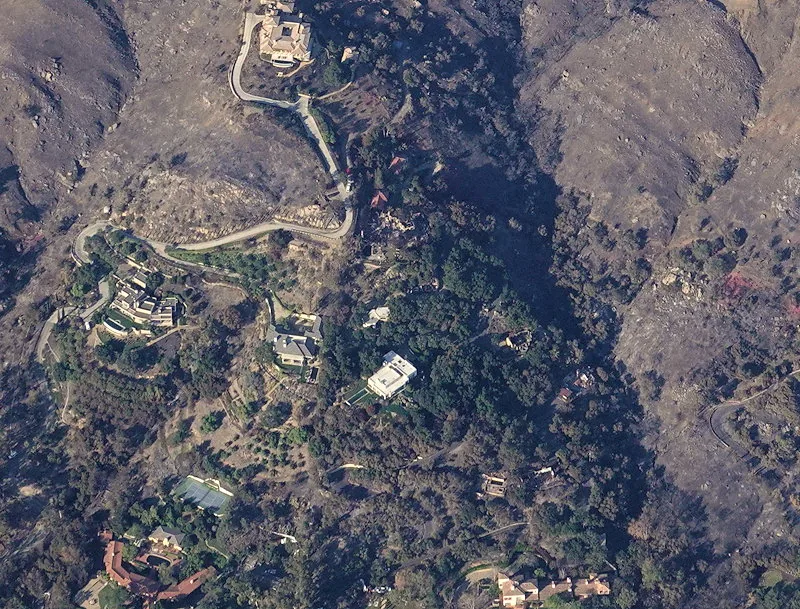
The southwestern edge of the Thomas Fire in the hills above Montecito, December 19, 2017 —
estates amid fresh burn where the fire's southward run met the 2008 Tea Fire footprint and
slowed on the younger fuels. Photo: John Wiley, via
Wikimedia Commons
(CC BY 3.0).
The signature local driver is the sundowner wind — a hot, dry downslope wind
that accelerates off the Santa Ynez crest in the evening, reversing the daytime sea breeze and
driving fire downhill toward the coast at exactly the hour crews expect conditions to ease. It
is what turned the Tea and Jesusita fires into fast structure-losses, and it is why the peak
risk window here stretches from early summer sundowners through the autumn Santa Ana season.
Sources: CAL FIRE Incident Archive · NIFC · Santa Barbara County Fire Department · USGS.
Terrain & vegetation
Estates in the canyons, chaparral directly above
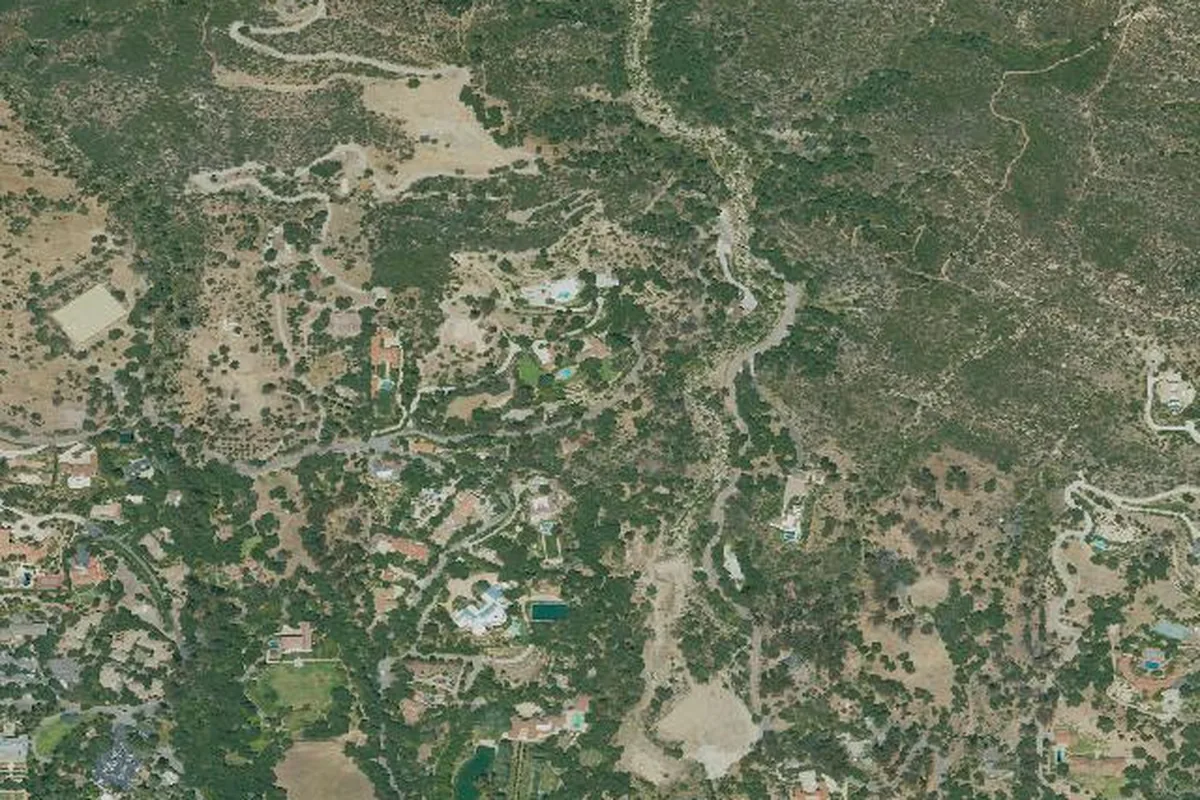
An East Mountain Drive address in Montecito sits at roughly 250 metres, on the foothill bench
where the residential canyons meet the open slopes of the front range. A Satelife property
report scores the immediate vegetation layer at 33.1 / 100 — a mix the model
reads as roughly equal parts urban, agricultural, and forest cover, the wooded-estate texture
that is characteristic of Montecito. The terrain layer scores 40/100 on the foothill elevation
band.
Those middling parcel-level readings sit under a Very High hazard
classification (State Responsibility Area) and a fire-history score of 80/100. The wooded
canopy that makes Montecito beautiful is also continuous fuel that carries fire between
estates, and the steep slope directly above every canyon home is what a sundowner wind uses.
The report's fire-spread sub-layer scores a non-trivial 39.9/100 here, and USFS data puts the
probability of flame lengths over four feet at this location at about 5% — modest, but not the
zero you see on a flat valley floor.
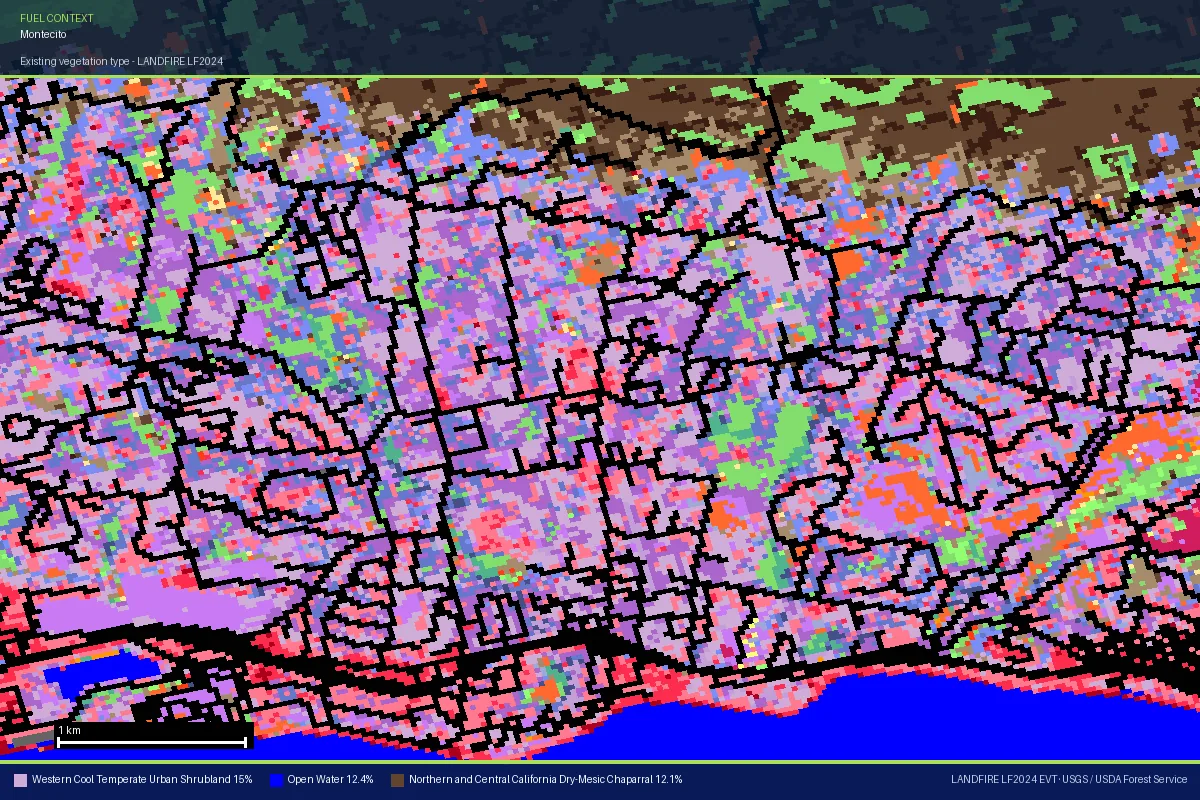
LANDFIRE LF2024 vegetation map of Montecito — the same public dataset behind the vegetation
layer in Satelife reports. The wooded-estate fabric (urban shrubland and evergreen forest,
~25% combined) fills the bench, and the brown band across the top is the dry-mesic chaparral
of the front range sitting directly above it. Data: LANDFIRE EVT · USGS / USDA Forest Service.
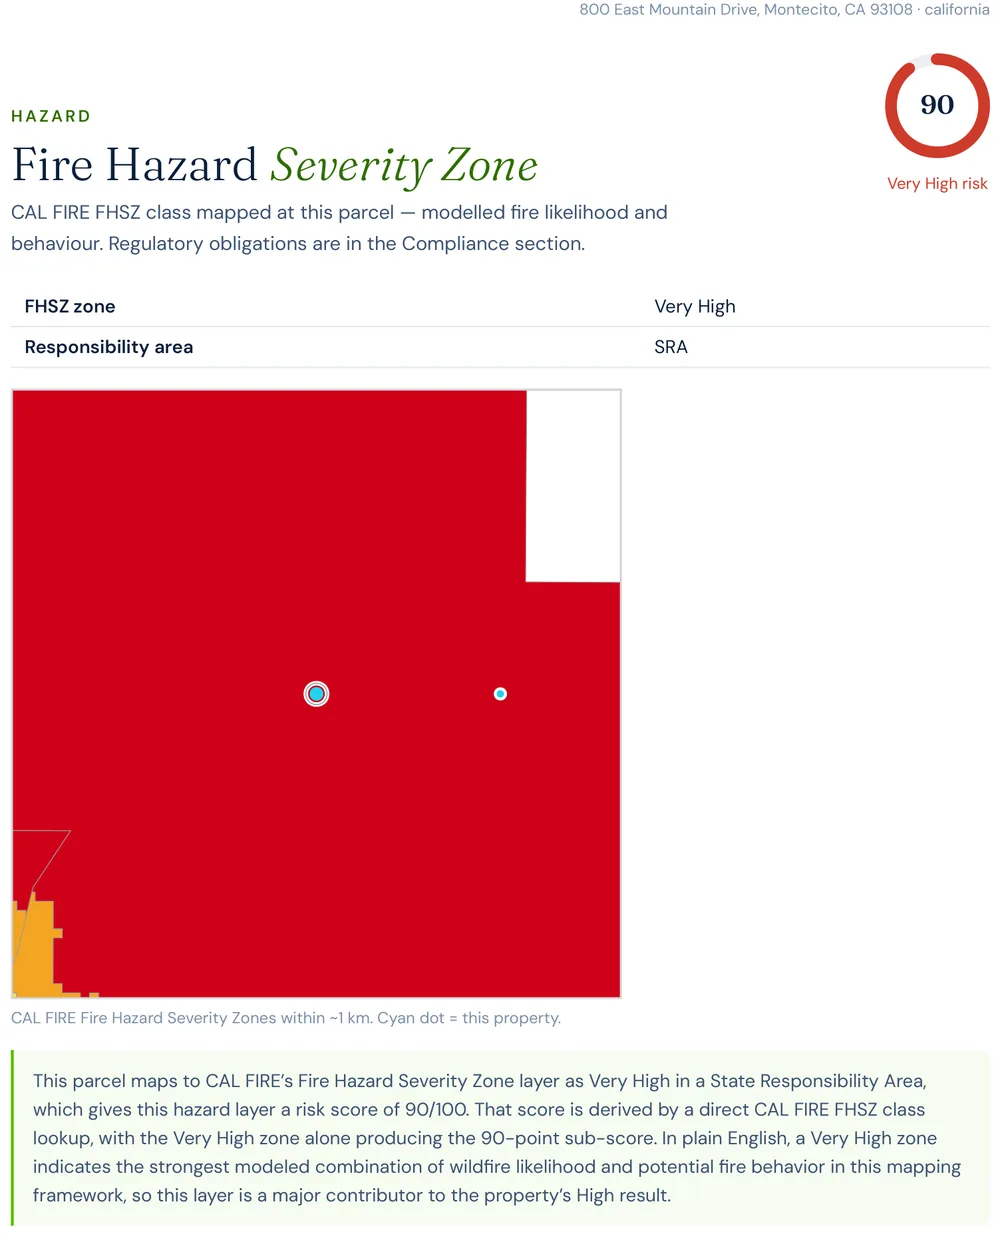
Report excerpt — Fire Hazard Severity Zone: the East Mountain Drive parcel sits
in CAL FIRE's Very High zone (State Responsibility Area). Satelife Wildfire Risk Report,
Montecito, CA (July 2026).
Evacuation
Five thousand structures woven through canyon roads
Satelife's community-scale analysis of Montecito builds the picture from the actual road graph
and structure footprints — 5,450 mapped structures across roughly 1,955
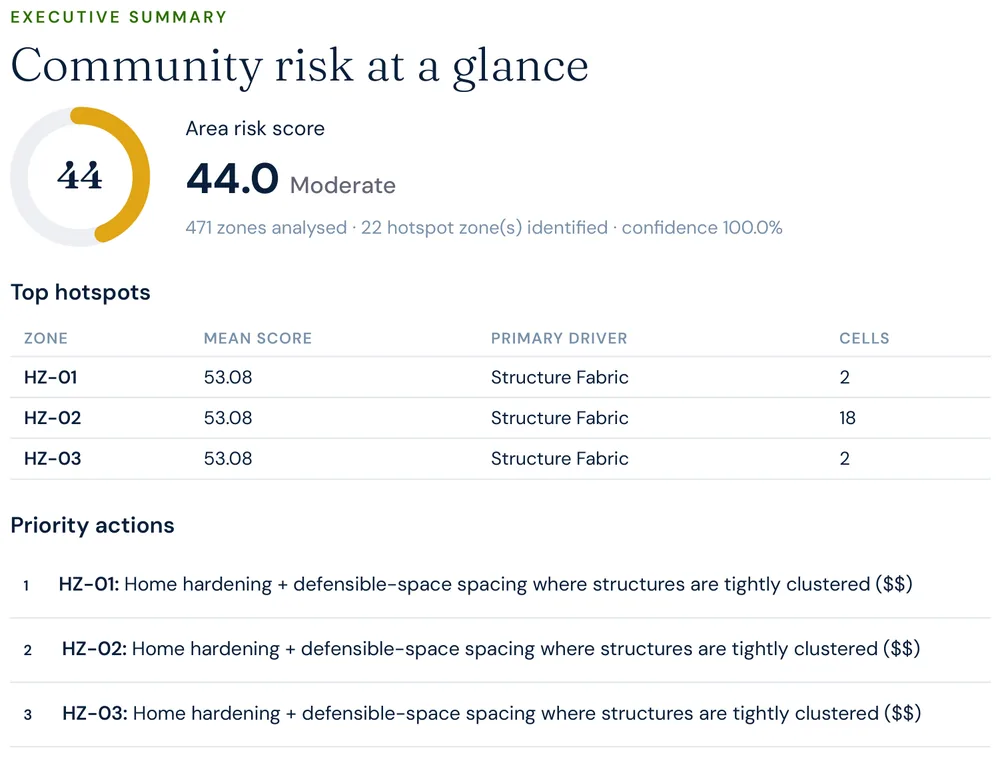
hectares, gridded into 471 hundred-metre zones and scored at 44.0 / 100 —
Moderate area-wide, with 22 named hotspot clusters where the risk concentrates.
5,450mapped structures in the analyzed community area
471hundred-metre zones scored (394 with structures)
47independent exit routes to the wider road network
22hotspot clusters, driven by tightly-packed structures
What the analysis flags in Montecito is not a single chokepoint but density:
the dominant driver behind every one of the 22 hotspot clusters is structure fabric — homes
packed tightly enough that fire spreads building-to-building, not just fuel-to-building. The
community's own executive summary names the priority accordingly: home hardening and
defensible-space spacing where structures are most tightly clustered. Forty-seven independent
exits sound like plenty, but they thread through the same narrow canyon roads — East Mountain
Drive, Hot Springs, Sycamore Canyon — that carried the 2017 Thomas evacuation and were then
buried by the 2018 debris flow.
Report excerpt — Executive summary, Satelife Neighborhood Wildfire Risk Report
for Montecito, CA (July 2026). Area risk 44.0/100, Moderate, 471 zones analysed, 22 hotspots.
The post-fire cascade
Montecito's real lesson: the risk outlived the fire
Most WUI communities have one post-fire story — how fast the fuel grows back. Montecito has a
second, worse one. When the Thomas Fire stripped the slopes above the town in December 2017, it
did not just reset the fuel clock; it destabilized the hillsides. Five weeks later, an intense
cell of rain on the bare burn scar produced debris flows that killed 23 people and destroyed 65
homes — more lives than the fire itself took in the county.
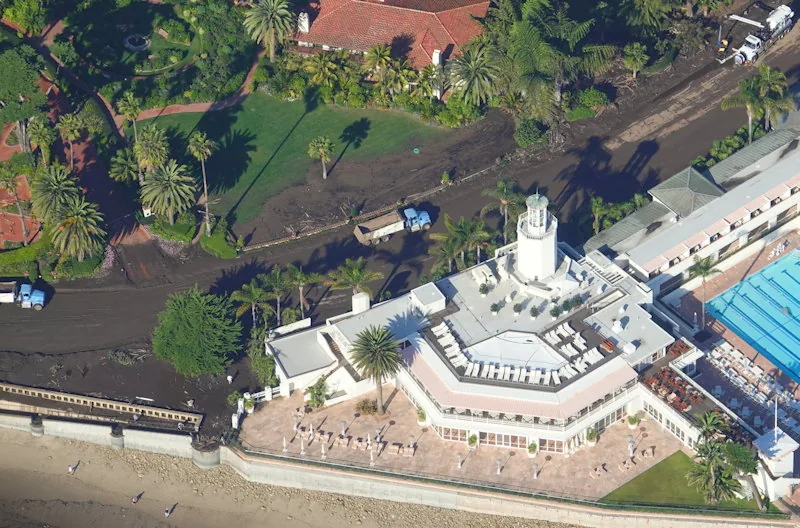
Two days after: debris-flow mud from the Thomas Fire burn scar covering the coast road at
Butterfly Beach, Montecito, January 11, 2018 — the flows ran the full three kilometres from
the front range to the ocean. Photo: John Wiley, via
Wikimedia Commons
(CC BY 3.0).
That cascade is why a single-number hazard map understates places like this. What does not reset:
The hazard classification. CAL FIRE's Fire Hazard Severity Zone model reads Very High at the East Mountain Drive parcel — 90/100 in Satelife's property-level hazard layer, in the State Responsibility Area.
The fire-history signal. Satelife's property fire-history layer scores 80/100 — four mapped perimeters in the last twenty years, headed by Thomas (2017), plus Jesusita (2009), Tea (2008), and the historic Coyote Fire (1964, 65,339 acres) on the record.
The terrain and sundowner exposure. The steep front range directly above town, and the evening downslope wind that runs down it, are permanent features. So is the debris-flow potential every time those slopes burn.
A Satelife report scores the standing wildfire risk of a parcel; it is not a debris-flow model.
But the two hazards share a cause, and Montecito is the reason to treat a Very High foothill
parcel as a long-term commitment, not a one-season worry.
One address on East Mountain Drive, Montecito, scored today
To make the county's risk concrete, we ran a full Satelife wildfire-risk report for a
property on East Mountain Drive, Montecito — in the foothills the Thomas Fire
reached and the 2018 debris flow ran through. The composite score:
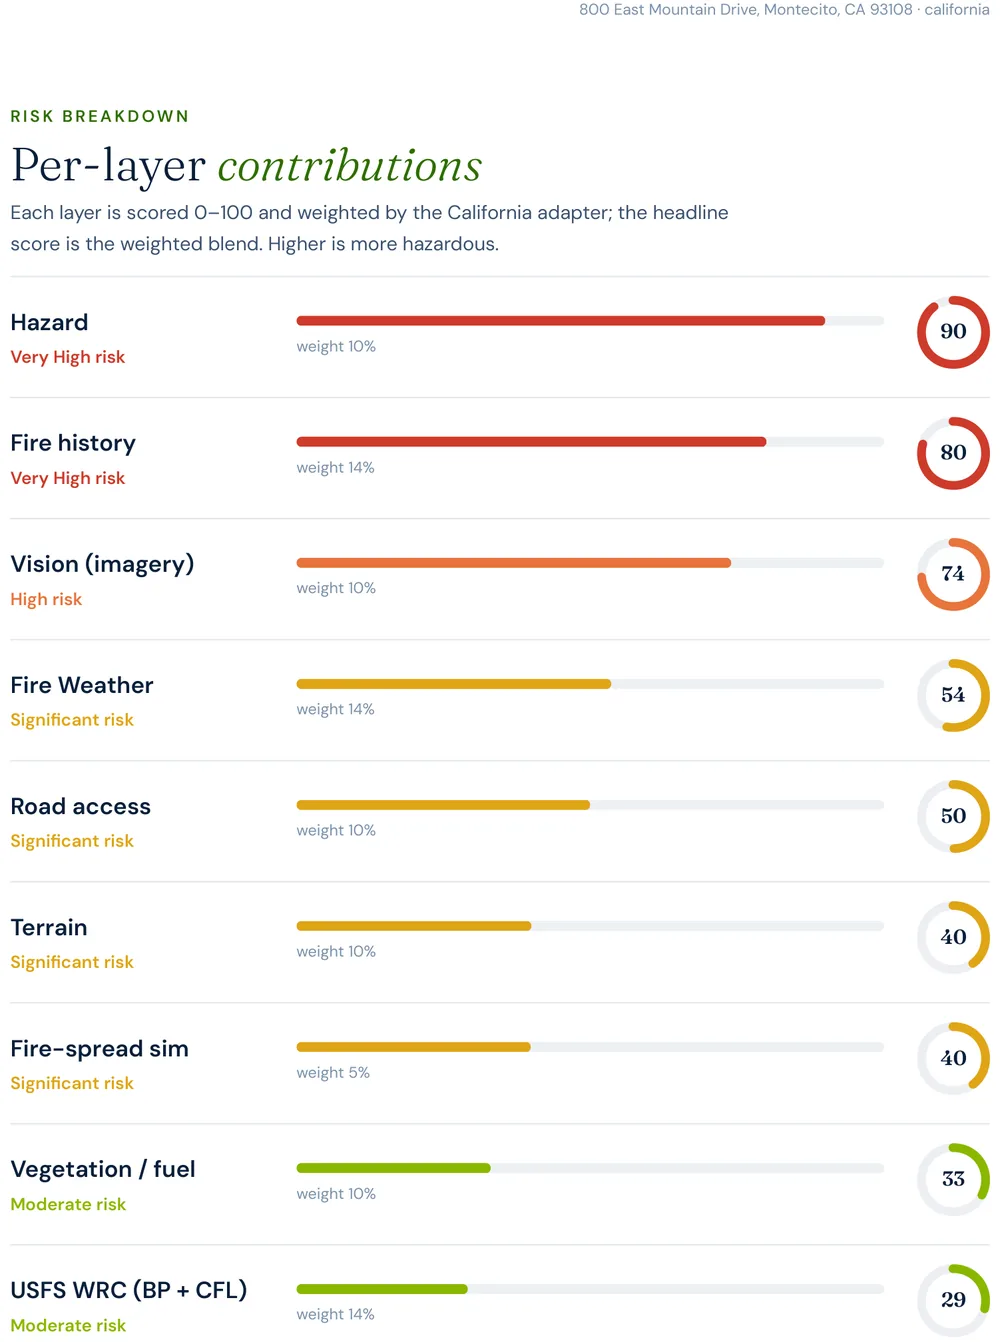
55.1 / 100 — High tier (86% confidence), built from ten independently-scored
data layers rather than one hazard polygon.
Report excerpt — Per-layer contributions, Satelife Wildfire Risk Report,
East Mountain Drive, Montecito, CA 93108 (July 2026). Composite 55.1/100, High tier.
What drives the score:
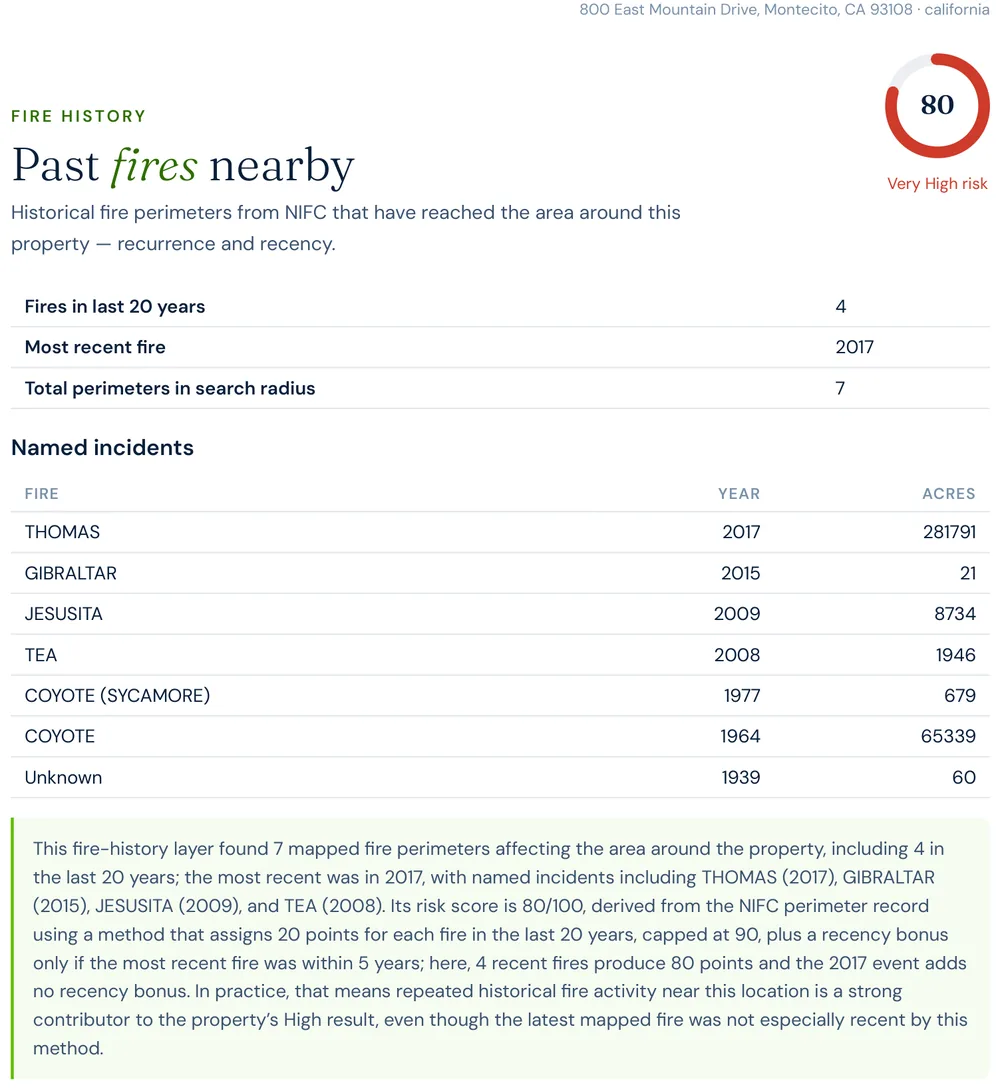
Fire history: 80/100 — and it names four fires. The layer finds 4 fires within 20 years at this parcel, out of 7 mapped perimeters total. THOMAS (2017, 281,791 acres) heads the list, followed by GIBRALTAR (2015), JESUSITA (2009, 8,734 acres), TEA (2008, 1,946 acres), and the historic COYOTE fire (1964, 65,339 acres).
Hazard zone: 90/100. The parcel sits squarely in CAL FIRE's Very High Fire Hazard Severity Zone (State Responsibility Area).
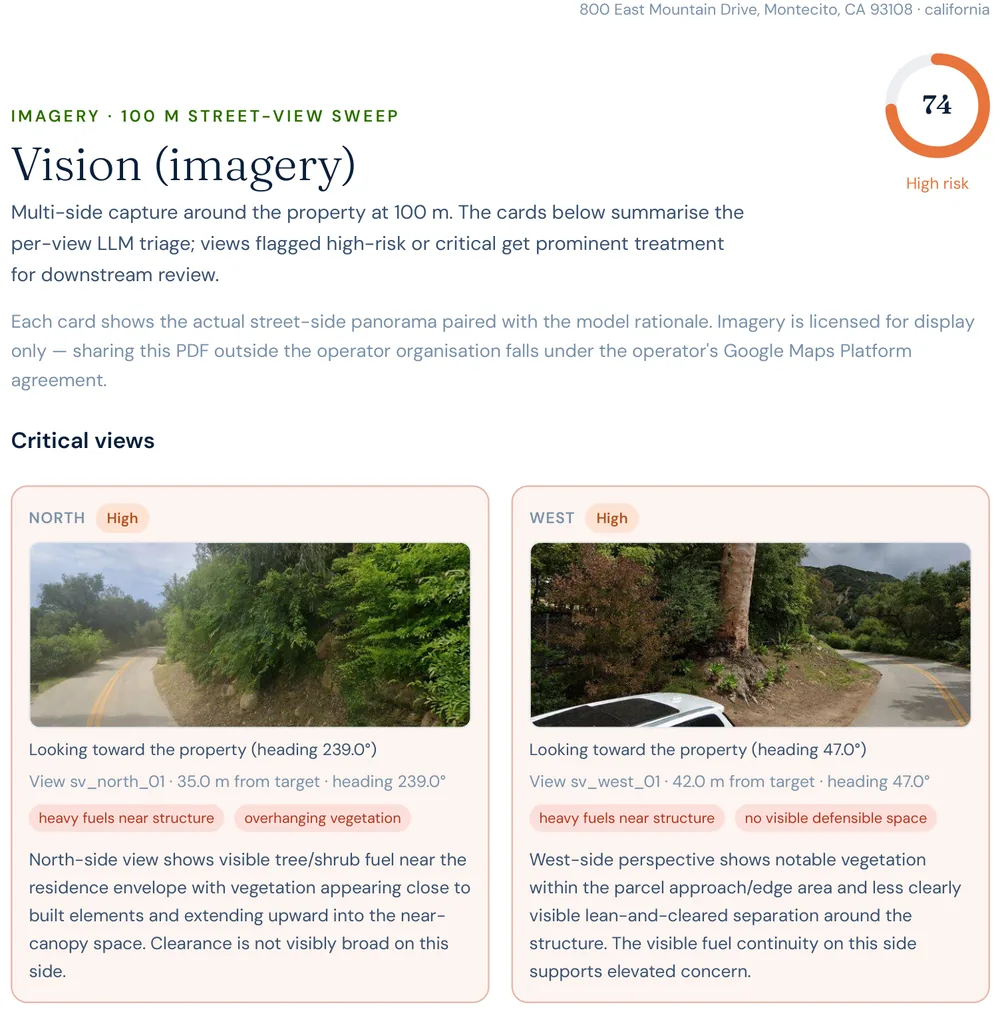
AI vision analysis: 74/100 — High. The model reads street-level imagery from all four sides: the north and west views rate High, flagging heavy fuels near the structure and overhanging vegetation with no visible open defensible space; the east and south views rate Medium.
Fire behavior: USFS Wildfire Risk to Communities data puts the probability of flame lengths over four feet at this location at roughly 5%, and the fire-spread sub-layer scores 39.9/100 — the continuous canyon canopy carries real spread potential, unlike a cleared valley floor.
Report excerpt — Fire history: the layer names the Thomas (2017), Jesusita
(2009), Tea (2008) and Coyote (1964) fires among the perimeters reaching this parcel.
Report excerpt — Vision sweep by direction: the north and west views rate
High, with findings like "heavy fuels near structure" and "no visible defensible space".
The FHSZ polygon says "Very High" for every estate in these canyons equally. The report says
this house has overhanging canopy on its north side and no cleared buffer to the west —
and which three actions, in order, change that.
The report pairs the score with a prioritized mitigation plan for this exact parcel:
establish an ember-resistant Zone 0 in the first five feet, harden the roof and screen vents
against ember intrusion, and maintain thirty feet of lean, clean and green space. Under
SB 1060-era rules, completing and documenting that work is not just safety advice — it is
insurance evidence.
Insurance & real estate
The insurance squeeze in Santa Barbara County
County homeowners feel all of the above through their insurance bill — when they can get one.
The south-coast foothill communities have seen a steady pattern of carrier non-renewals
followed by migration to the California FAIR Plan, the state's insurer of last
resort, which surpassed 400,000 policies statewide in 2024 — roughly double its 2020 count.
FAIR Plan coverage is more expensive and thinner than the policies it replaces, and in a market
of high-value Montecito estates the gap between a bindable policy and a FAIR-Plan-plus-wrap
arrangement is large.
The regulatory response matters here: SB 1060 (in force 2025) requires
carriers that use wildfire risk models to account for property- and community-level
mitigation — defensible space, home hardening, community fuel breaks — rather than pricing on
hazard zone alone. Together with the Safer from Wildfires framework, that creates a financial
reason to prove, with evidence, what your specific parcel looks like. A zone map can't do that.
An address-level report can.
For buyers and sellers, California Civil Code §1103 requires Natural Hazard Disclosure at the
point of sale — and on the south coast, that disclosure now sits alongside a live debris-flow
history a buyer's insurer will weigh. A buyer who cannot bind insurance cannot close. See
California wildfire insurance
and
California real estate wildfire risk.
Sources: California Department of Insurance · California FAIR Plan · SB 1060 text.
Risk reduction
What Santa Barbara County homeowners can actually do
CAL FIRE's defensible-space framework defines three zones: Zone 0 (0–5 ft, ember-resistant,
no combustibles), Zone 1 (5–30 ft, lean-clean-green), and Zone 2 (30–100 ft, reduced fuel).
Documented compliance is what underwriters and the SB 1060 discount process accept as evidence.
Locally, the Santa Barbara County Fire Department and the
Santa Barbara County Fire Safe Council coordinate defensible-space inspections
and fuel-reduction work across the front-range communities, and Montecito's own fire-protection
district runs suppression response for the canyons.
Annual review is the rule, not the exception: chaparral regrows fast under a sundowner-wind
regime, and in canyons that have burned repeatedly a multi-year gap between inspections is not a
safe assumption. A parcel that passed inspection in 2024 is not necessarily compliant in 2026.
It is worth naming how differently that risk is shaped here versus the neighboring counties. In
Ventura County's
Ojai, the constraint is a bowl of a valley with few exits. In Montecito, fire-service reach is
close but the constraint is density — 5,450 structures woven through canyon roads, where fire
moves house-to-house — layered on top of a debris-flow history no fuel-clearing can undo. Same
state, same season, three different failure modes; only a property- and community-level read
tells you which one is yours.
Montecito is the clearest proof that wildfire risk is a system, not a line on a map: the fire,
the fuel that grows back, the wind that drives it downhill, and the burn scar that turns the
next storm into a second disaster. A single hazard band can't hold all four. A layered,
address-level report can.
Coverage
ZIP codes we cover in Santa Barbara County
Satelife runs address-level wildfire reports across every ZIP code in Santa Barbara County.
The ZIPs below are the high Fire Hazard Severity Zone, Wildland-Urban Interface
communities we are asked about most. One caveat that is the whole point of what we
do: the risk score is computed for your parcel, not the ZIP, so two
homes on the same street can land in different tiers. Find your area, then
run your address.
ZIP code
Community
Why it is on the map
93108
Montecito
Thomas Fire, Tea Fire & 2018 debris flow; East Mountain Drive case study
93103
Santa Barbara (Riviera)
2008 Tea Fire footprint, eastside foothills
93105
Santa Barbara (Mission Canyon)
2009 Jesusita Fire; San Roque canyon WUI
93013
Carpinteria
Thomas Fire foothills and debris-flow exposure
93117
Goleta
2019 Cave Fire and 2016 Sherpa Fire interface
93101
Santa Barbara
Downtown-adjacent foothill WUI below the front range
93067
Summerland
South-coast foothill WUI east of Montecito
93460
Santa Ynez
Backcountry and San Rafael interface, 2007 Zaca Fire
ZIP areas per USPS; Wildland-Urban Interface and Fire Hazard Severity Zone framing per CAL FIRE.
Frequently asked questions about Santa Barbara County wildfire risk
Is Santa Barbara County a high wildfire risk area?
Yes, particularly the south-coast foothill communities below the Santa Ynez Mountains — Montecito, the Santa Barbara Riviera, Mission Canyon, Carpinteria, and Goleta. These areas sit in CAL FIRE High or Very High Fire Hazard Severity Zones and are exposed to sundowner winds, a local evening downslope wind that has driven several of the county's most destructive fires. The county was burned by the 2017 Thomas Fire and, a month later, by the deadly Montecito debris flow that the fire's burn scar unleashed.
What was the largest wildfire in Santa Barbara County?
By acreage, the 2007 Zaca Fire — 240,207 acres in the San Rafael Mountains of the Los Padres National Forest, at the time California's second-largest recorded wildfire. By impact on the south-coast communities, the 2017 Thomas Fire (281,893 acres across Santa Barbara and Ventura counties) is the reference event: it burned into the foothills above Montecito and Carpinteria and set up the January 2018 debris flow.
What happened in Montecito after the Thomas Fire?
On January 9, 2018, about a month after the Thomas Fire stripped the vegetation from the slopes above Montecito, an intense burst of rain — roughly half an inch in five minutes — triggered debris flows off the burn scar. They killed 23 people, destroyed 65 homes and damaged more than 460. It is the clearest example in California of how wildfire risk does not end when the fire is out: the burn scar itself became the next hazard.
How do I check the fire hazard zone for my Santa Barbara County address?
Use the CAL FIRE FHSZ viewer for the official Moderate / High / Very High zone classification. For property-level detail — terrain, fuels, fire history, evacuation constraints, and an AI read of your actual parcel imagery — run a Satelife address-level report.
Can wildfire mitigation lower my insurance premium in Santa Barbara County?
Yes. Under SB 1060 (in force 2025), California carriers that use wildfire risk models must account for property- and community-level mitigation. Documented defensible space and home hardening — the kind of evidence a Satelife report captures — feeds directly into that discount pathway, alongside the Safer from Wildfires framework. The Montecito and Santa Barbara foothills have felt the same non-renewal pressure as the rest of Southern California since the Thomas Fire.
Scores and evacuation figures on this page are drawn from Satelife wildfire-risk reports for
Montecito, CA generated in July 2026 (property report, East Mountain Drive; neighborhood analysis,
Montecito, a 2.5 km community boundary). The January 2018 Montecito debris flow is described for
context; Satelife reports score wildfire risk and are not a debris-flow or flood determination.
Satelife reports are informational decision support — not a substitute for official evacuation
orders, CAL FIRE hazard determinations, or an insurer's underwriting judgement.
What does your parcel look like, layer by layer?
If you own, are buying, or are rebuilding in Santa Barbara County — Montecito, the Santa Barbara Riviera, Mission Canyon, Carpinteria, or anywhere along the south-coast foothills — get the address-level answer: PDF, ten-layer score, and a prioritized mitigation plan.