Wildfire risk in Nevada County: the fuel that hasn't burned yet
California's insurance regulator ranks Nevada County third in the state
for the concentration of homes in high fire-risk exposure. Its recent fire
record is one of the quietest in the Sierra foothills. A Satelife report for an Alta Sierra address
scores 48 / 100 — the same composite as a street in Paradise — with a
28.1% modelled probability of four-foot flames and the fuel still
standing.
A fire record that reads reassuringly — and shouldn't
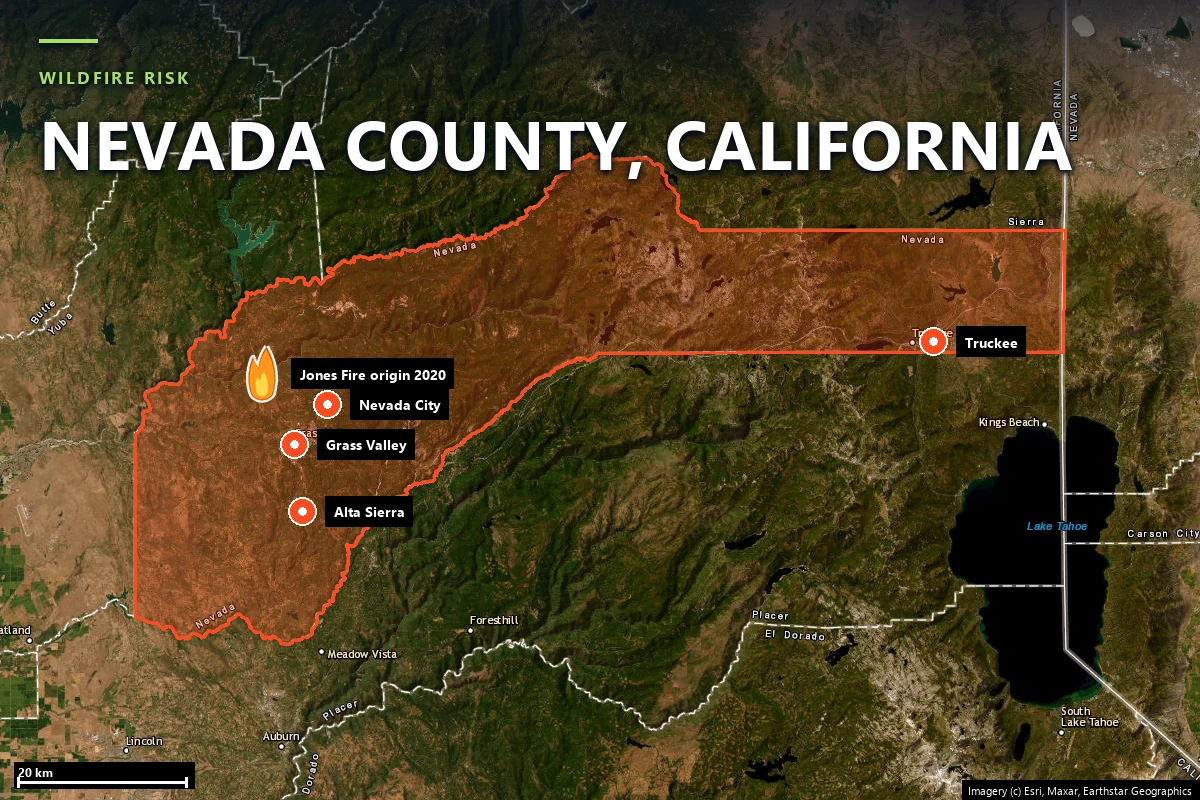
Nevada County spans from the Sacramento Valley edge near Penn Valley, across the gold-rush
foothill belt at Grass Valley and Nevada City, up over the Sierra crest to Truckee. Almost
all of its population lives in the western third, in low-density housing scattered through
continuous oak woodland and foothill pine. It is, in structural terms, one of the most
thoroughly interfaced counties in the state — there is very little boundary between "town"
and "forest" to point at. The California Department of Insurance, ranking counties by the
share of homes sitting in high fire-risk exposure, placed Nevada County
third statewide.
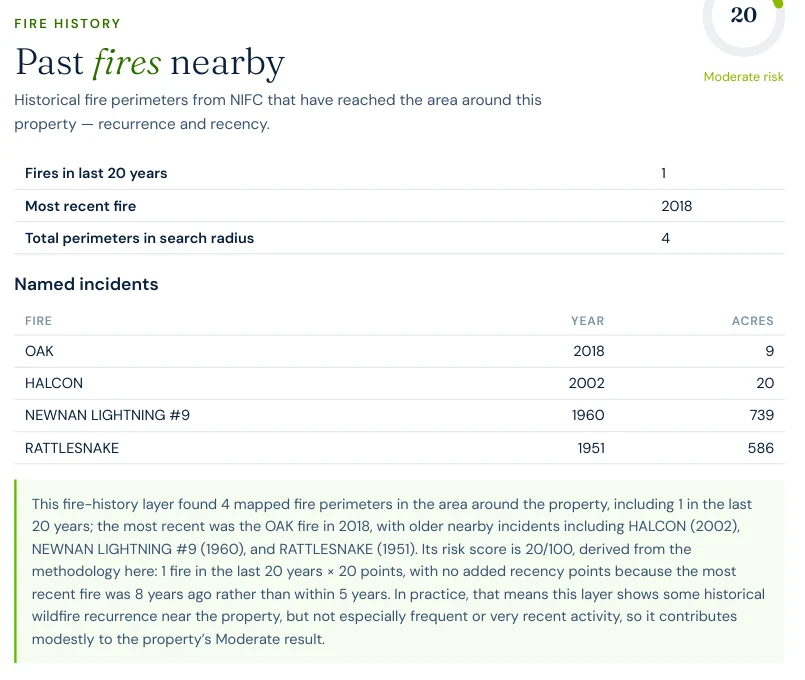
Now look at what the fire-history layer returns for an Alta Sierra parcel. Four mapped NIFC
perimeters in total. One in the last twenty years.
Oak Fire (2018) — 9 acres.
Halcon Fire (2002) — 20 acres.
Newnan Lightning #9 (1960) — 739 acres.
Rattlesnake Fire (1951) — 586 acres.
That is a seventy-five-year record with nothing in it larger than a square mile. The
county's benchmark event, the 49er Fire of September 1988 — roughly
33,700 acres and more than 300 structures across Rough and Ready, Penn Valley and Lake
Wildwood — burned west of Grass Valley, outside the search radius of this particular
parcel and now old enough that a recurrence-based score barely registers it. The resulting
fire-history layer scores 20 / 100 — Moderate, the lowest layer in the
whole report.
What the county has had since is small and quickly caught: the Jones Fire
(August 2020) burned 705 acres and 18 structures in the Yuba River drainage northwest of
Nevada City, and the Rices Fire (June 2022) burned 904 acres and four
structures near Rices Crossing. Both were held to under a thousand acres. Neither tested
the fuel bed that surrounds Grass Valley.
A quiet fire record is not evidence of safety. In a fuel type that carries fire every few
decades, it is a statement about accumulated fuel and about how long it has been
accumulating.
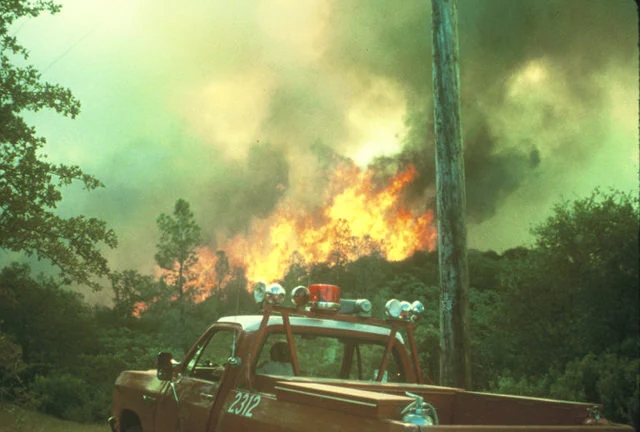
The 49er Fire, Nevada County, 1988 — fire running through the same oak-woodland fuel
type that still surrounds Grass Valley. Source: CAL FIRE, via
Wikimedia Commons
(public domain).
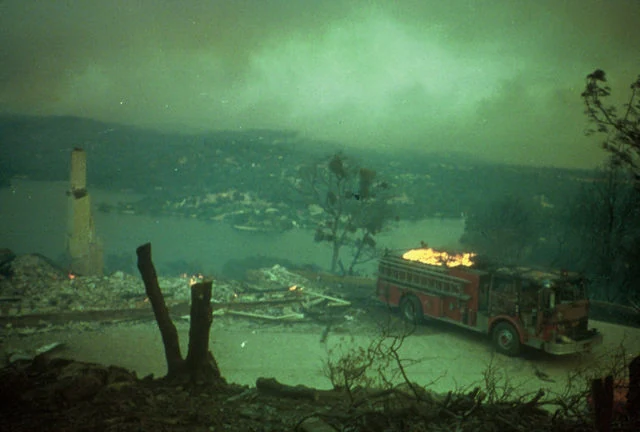
Structural loss in the 49er Fire, 1988 — the last time this fuel bed burned at scale
near Grass Valley. Source: CAL FIRE, via
Wikimedia Commons
(public domain).
Sources: NIFC fire perimeters (via Satelife fire-history layer) · CAL FIRE Incident Archive.
Terrain & vegetation
Where the houses are the forest
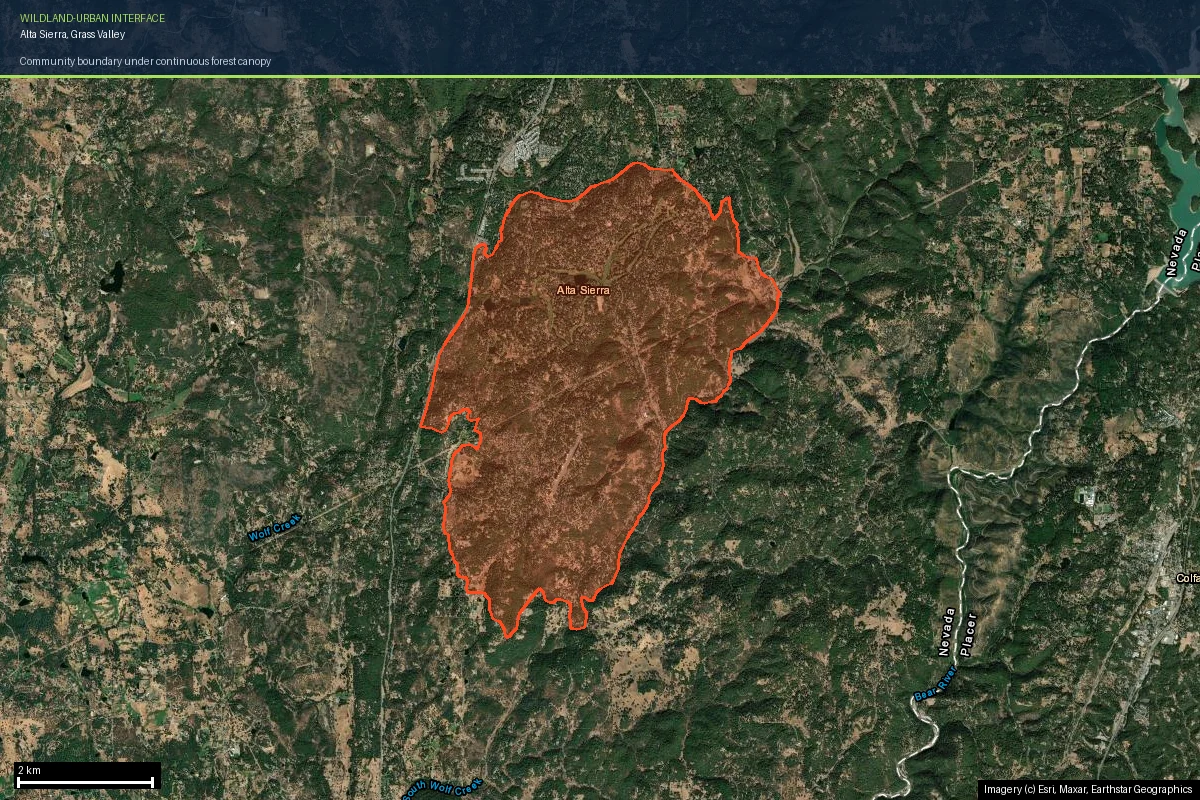
Alta Sierra is the clearest example of the county's settlement pattern: a census-designated
place of 7,204 residents spread across roughly 2,148 hectares of ridges and
drainages south of Grass Valley, with parcels cut into standing timber rather than cleared
from it. On satellite imagery the community is hard to distinguish from the forest around
it — which is precisely the problem.
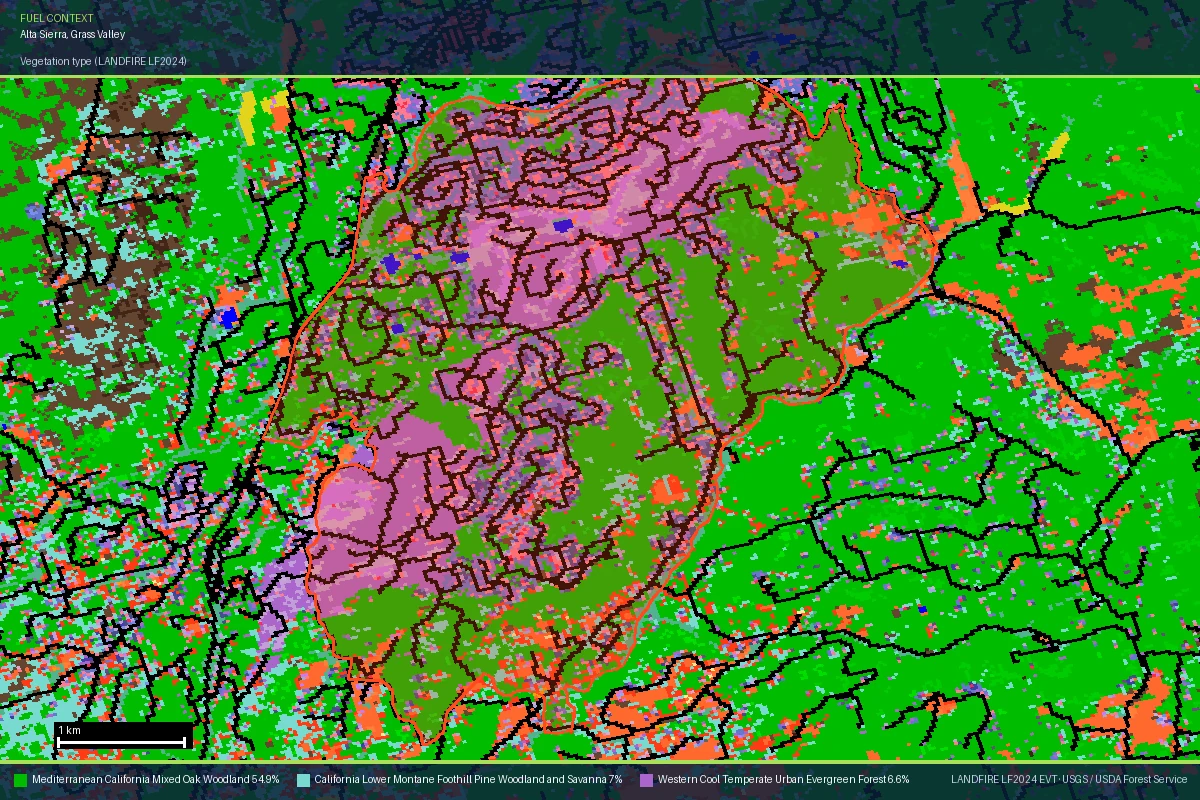
The LANDFIRE vegetation layer that feeds Satelife's fuel score makes the structure
explicit. Across the community: 54.9% Mediterranean California mixed oak
woodland, 7.0% lower montane foothill pine woodland and savanna,
5.2% dry-mesic chaparral — and 6.6% classified as "urban evergreen forest",
the class LANDFIRE uses for developed land that still carries a closed evergreen canopy.
That 6.6% is the built core of Alta Sierra, and the classifier is telling you it reads as
forest.
Vegetation type across Alta Sierra — LANDFIRE LF2024 Existing Vegetation Type, the same
layer that produces the report's fuel score. The violet core is developed land that
LANDFIRE still classifies as evergreen forest. Source: LANDFIRE LF2024 EVT · USGS / USDA
Forest Service.
Terrain compounds it. The community sits on the broken ground between the Bear River and
Wolf Creek drainages, and the terrain layer scores 65 / 100 on slope and
aspect alone. The fire-weather layer — a thirty-year ERA5 climatology of the Canadian Fire
Weather Index at this location — reads 65 / 100, materially hotter and
drier than the 56 / 100 the same layer returns for Paradise in Butte County.
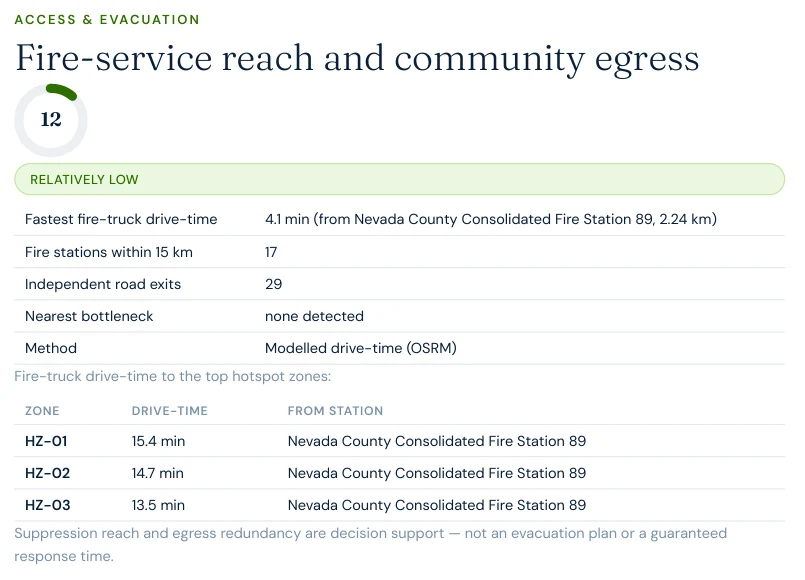
Satelife's community-scale analysis of Alta Sierra gridded 2,148 hectares into 346 analysis
zones and rebuilt the access picture from the current road graph and OSM-mapped fire
stations. On the headline egress measures the community does well:
29independent road exits from the analyzed area
11.9analysis zones per exit route
4.1 minmodelled fire-truck drive-time from Nevada County Consolidated Station 89 (2.24 km)
13–15 minmodelled drive-time to the community's top hotspot zones
Twenty-nine exits, seventeen stations within fifteen kilometres, no single-point bottleneck
detected on the modelled network. The nearest station the model picks — Nevada County
Consolidated Fire Station 89 on Tammy Way, beside the Alta Sierra golf course — is staffed
around the clock and carries a Type III wildland engine alongside its structure engines, so
the 4.1-minute figure is a real capability rather than an artefact of a mapped-but-volunteer
station. Taken alone, that is a healthy egress profile — better than Grizzly Flats in
El Dorado County,
which returned nine exits and a 32-minute nearest-station drive-time.
The number that deserves attention is a different one. The same report identifies
29 separate hotspot zones — clusters where modelled risk concentrates —
against 8 for the Town of Paradise. Alta Sierra's risk is not funnelled
into one or two obvious pinch points that a fuel break could address. It is distributed
across the whole community, which is what a uniform fuel bed with houses embedded in it
produces. And the drive-times to those hotspots run 13 to 15 minutes, roughly double the
5 to 10 minutes measured into Paradise's hotspots.
Report excerpt — Access & Evacuation, Satelife Neighborhood Wildfire
Risk Report for Alta Sierra, CA (July 2026). Modelled OSRM drive-times from OSM-mapped
stations; volunteer-staffed stations are frequently absent from OSM and would shorten
local response. Decision support, not an evacuation plan or a guaranteed response time.
Fire behaviour
What the federal model says about four-foot flames
The cleanest way to see the difference between a burned county and an unburned one is the
USFS Wildfire Risk to Communities layer, which models burn probability and conditional
flame length from the actual fuel bed. At the Alta Sierra parcel it returns
49 / 100, and a 28.1% probability of flame lengths exceeding four
feet in a fire event.
Four feet is the operational threshold at which direct attack by hand crews stops working
and the fight becomes an equipment-and-air-support problem. A 28% chance of crossing it is
the modelled fuel bed telling you what kind of fire this landscape is currently able to
produce. For comparison, the same model at our Paradise case study returns 8 / 100 and a
probability of 0.0% — because the fuel there burned in 2018 and has not
grown back yet.
Set the two hazard framings side by side and the county's real position is clear:
90CAL FIRE hazard zone layer — Very High, unchanged
49USFS WRC fire-behaviour model (Paradise: 8)
28.1%modelled probability of flame lengths over 4 ft (Paradise: 0.0%)
20fire-history layer — one fire in twenty years
The layer that looks best on this page — a near-empty fire history — is the one doing the
most to make the headline number look comfortable. It is also the one with the least to say
about what happens next.
Case study
One address on Alta Sierra Drive, scored today
We ran a full Satelife wildfire-risk report for a property on Alta Sierra Drive,
Grass Valley — inside the Very High zone, inside the canopy, with no significant
fire in living memory. The composite: 48 / 100 — Moderate tier, at 0.84
confidence, from ten independently-scored layers.
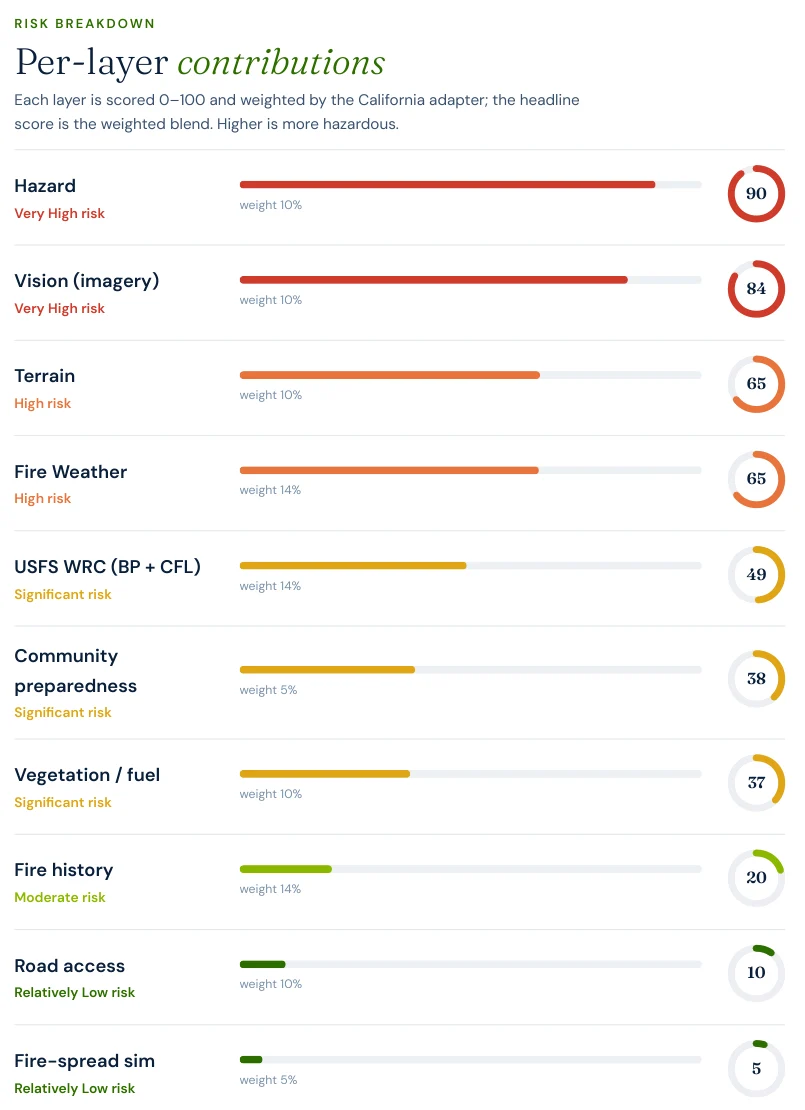
Report excerpt — Per-layer contributions, Satelife Wildfire Risk Report,
Alta Sierra Drive, Grass Valley, CA 95949 (July 2026). Composite 48/100, Moderate tier.
What drives the score:
Hazard zone: 90/100. CAL FIRE Very High Fire Hazard Severity Zone.
AI vision analysis: 84/100 — Very High, and the second-highest layer. The model reads the parcel's own imagery and finds a semi-rural wooded setting with moderately continuous canopy across the parcel and adjoining land, mature trees near and partly over the structure and drive approach, and maintained space that stops short of the full defensible-space envelope. Two of the four street-view aspects are flagged for heavy fuels near the structure.
Fire weather: 65/100. Thirty-year ERA5 climatology of the Canadian Fire Weather Index — hotter and drier than the Butte County comparison.
Fire history: 20/100. One fire in twenty years, nine acres. The lowest layer in the report, and the reason the composite reads Moderate rather than High.
Report excerpt — Fire history: four mapped NIFC perimeters in
seventy-five years, one of them in the last twenty. The layer scores recurrence, and there
is very little to score.
Two houses, ninety minutes apart, both scoring 48. In Paradise the number is held up by
fire history and held down by an absent fuel bed. In Alta Sierra it is the exact reverse.
The composite is identical; the correct next action is not.
The report pairs the score with a prioritized plan for this parcel: audit defensible space
annually before fire season, and verify access-route width and gate clearance — the second
one carrying more weight here than it would elsewhere, given roadside canopy along the
subdivision's internal roads. Under the Safer from Wildfires rules, completing and documenting
that work is insurance evidence, not just safety advice.
Insurance & real estate
Underwriting does not wait for a fire history
Carriers do not price Nevada County off its quiet perimeter record — they price it off
hazard zone, fuel model and structure exposure, all three of which read badly here. This
is not a hypothetical. When the California Department of Insurance ranked counties by the
concentration of homes in high fire-risk exposure, Nevada County came third in the
state, behind only Tuolumne and Trinity. Across that top-ten group, policy
non-renewals rose from 6,372 in 2018 to 19,282 in 2019 — a 203% increase
against 31% statewide — and Nevada County was one of six counties that wrote more new FAIR
Plan policies in the first seven months of 2019 than in the whole of 2015–2018 combined.
That pressure has not eased. The California FAIR Plan, the insurer of last
resort, reported 668,609 policies in force in December 2025 — a 146%
increase since September 2022, against roughly $724 billion of exposure. FAIR Plan coverage
is more expensive and thinner than what it replaces.
This is the specific trap for a Nevada County homeowner: the intuition that "we have never
had a big fire here" is contradicted by the underwriting, and the composite risk score —
pulled toward Moderate by the same quiet history — can appear to support the intuition.
The per-layer breakdown is what resolves it, and it is also what an insurer's mitigation
review is asking about. Under Safer from Wildfires (10 CCR § 2644.9),
every admitted carrier that prices on wildfire risk must offer discounts for documented
mitigation at the structure, defensible-space and community levels — which makes dated
parcel evidence financially material rather than merely prudent.
For buyers and sellers, California Civil Code §1103 requires Natural Hazard Disclosure at
the point of sale, and fire-zone status is increasingly a closing-risk variable rather than
a paperwork item — a buyer who cannot bind insurance cannot close. See
California wildfire insurance
and
California real estate wildfire risk.
Sources: California Department of Insurance · California FAIR Plan · 10 CCR § 2644.9 (Safer from Wildfires).
Risk reduction
What Nevada County homeowners can actually do
CAL FIRE's defensible-space framework defines three zones: Zone 0 (0–5 ft, ember-resistant,
no combustibles), Zone 1 (5–30 ft, lean-clean-green), and Zone 2 (30–100 ft, reduced fuel).
In a community where the canopy is continuous and parcels are large and wooded, Zone 2 work
is where the effort goes — and it is the zone most often left undone, because it usually
means removing trees people bought the property for. The Fire Safe Council of Nevada County
coordinates chipping and community fuel-reduction programs that make that work affordable
at the neighborhood scale, which is the scale at which the 29 hotspot zones above actually
respond.
The comparison that makes the point is
Butte County.
Paradise and Alta Sierra return the same composite — 48 / 100 — and almost nothing else in
common. Paradise: fire history 80, USFS WRC 8, four-foot flame probability 0.0%, hotspot
drive-times 5 to 10 minutes, 8 hotspot zones. Alta Sierra: fire history 20, USFS WRC 49,
four-foot flame probability 28.1%, hotspot drive-times 13 to 15 minutes, 29 hotspot zones.
In Butte County the mitigation question is how to build back into a hazard that never
changed. In Nevada County it is how to reduce a fuel load before it is tested for the first
time in a generation.
Coverage
ZIP codes we cover in Nevada County
Satelife runs address-level wildfire reports across every ZIP code in Nevada County.
The ZIPs below are the high Fire Hazard Severity Zone, Wildland-Urban Interface
communities we are asked about most. One caveat that is the whole point of what we
do: the risk score is computed for your parcel, not the ZIP, so two
homes on the same street can land in different tiers. Find your area, then
run your address.
ZIP code
Community
Why it is on the map
95949
Grass Valley (Alta Sierra)
Forested subdivision WUI; Alta Sierra Drive case study
95945
Grass Valley
City core with continuous canopy to the boundary
95959
Nevada City
Historic county seat inside mixed conifer
95946
Penn Valley
Lake Wildwood; inside the 1988 49er Fire footprint
95975
Rough and Ready
Oak woodland and grass WUI west of Grass Valley
95924
Cedar Ridge
Highway 174 forest corridor between Grass Valley and Colfax
95960
North San Juan
San Juan Ridge community above the Yuba canyons
96161
Truckee
East-county Sierra crest; a different fuel and snow regime
ZIP areas per USPS; Wildland-Urban Interface and Fire Hazard Severity Zone framing per CAL FIRE.
Frequently asked questions about Nevada County wildfire risk
Is Nevada County a high wildfire risk area?
Yes, and for a reason that does not show up in a fire-history search. The populated western county — Grass Valley, Nevada City, Alta Sierra, Penn Valley, Cedar Ridge — sits in CAL FIRE High and Very High Fire Hazard Severity Zones under a largely intact fuel bed. A Satelife hazard layer for an Alta Sierra address reads 90/100, and the USFS Wildfire Risk to Communities model puts the probability of flame lengths over four feet at 28.1% there.
When did Nevada County last have a major wildfire?
The county’s benchmark event is the 1988 49er Fire, west of Grass Valley. Since then the record near Grass Valley has been unusually quiet: the Satelife fire-history layer for an Alta Sierra parcel finds only four mapped NIFC perimeters in total and just one in the last twenty years — the 2018 Oak Fire, at nine acres. That quiet record is exactly why the fuel is still standing.
Why does my Nevada County score look moderate when the hazard zone is Very High?
Because the composite blends ten layers and the fire-history layer is scored on recurrence. Around Alta Sierra it reads 20/100 — one fire in twenty years. That pulls the headline number down while the hazard layer sits at 90/100, fire weather at 65/100 and the federal fire-behaviour model at 49/100. The composite is a summary, not a verdict; the per-layer breakdown is where the decision lives.
How do I check the fire hazard zone for my Grass Valley or Nevada City address?
Use the CAL FIRE FHSZ viewer for the official Moderate / High / Very High classification. For property-level detail — terrain, fuels, fire history, evacuation constraints, and an AI read of your actual parcel imagery — run a Satelife address-level report.
Can wildfire mitigation lower my insurance premium in Nevada County?
Yes. California’s Safer from Wildfires regulation (10 CCR § 2644.9, effective October 2022) requires every admitted insurer that prices on wildfire risk to offer discounts for twelve specific mitigation measures — covering the structure, the defensible-space zone around it, and community-level designations such as Firewise USA. Documented defensible space and home hardening, of the kind a Satelife report captures and dates, is the evidence that pathway runs on.
Scores and evacuation figures on this page are drawn from Satelife wildfire-risk reports
generated in July 2026 (property report, Alta Sierra Drive, Grass Valley CA 95949;
neighborhood analysis, Alta Sierra CDP boundary). Drive-times are modelled on OSM-mapped fire
stations and the current road graph. Satelife reports are informational decision support —
not a substitute for official evacuation orders, CAL FIRE hazard determinations, or an
insurer's underwriting judgement.
What does your parcel look like, layer by layer?
If you own or are buying in Nevada County — Grass Valley, Alta Sierra, Nevada City, Penn Valley, Cedar Ridge or the San Juan Ridge — get the address-level answer: PDF, ten-layer score, and a prioritized mitigation plan.