On May 19, 2026, the Bain Fire ignited in the dry Santa Ana River bottom at Limonite Avenue and Bain Street in Jurupa Valley. It grew to 1,473 acres, destroyed one structure and damaged five more, injured four civilians and a firefighter, and forced evacuations across the river into Riverside before CAL FIRE reached 100% containment on May 29.
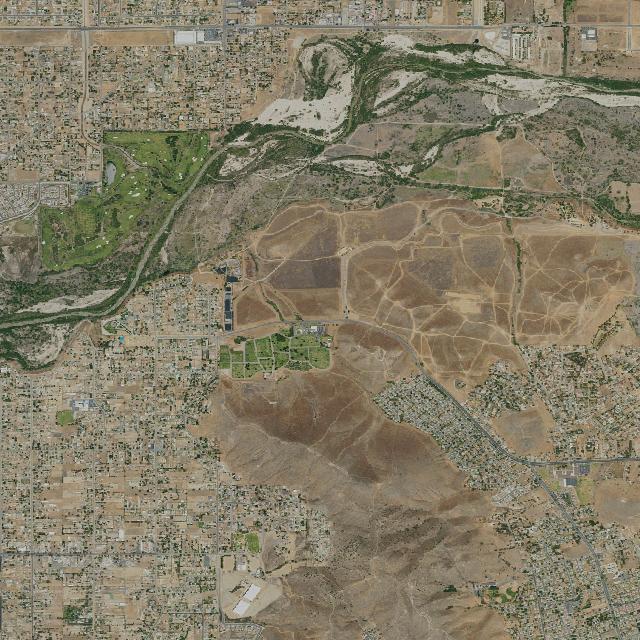
What makes it a clean teaching case is where it burned. The river bottom reads on most maps like an empty green ribbon between two cities — yet it has burned repeatedly for half a century, with homes pressed against both banks. Here is what Satelife’s address-level report shows for the corner where the fire started.
One score, ten explainable layers
Satelife scores the Jurupa Valley ignition area at 45.2 / 100 — Moderate (85% confidence). The number isn’t a black box: it’s a weighted blend of ten layers, each scored 0–100. Here the hazard zone and fire history both max out, while fire weather, fuels and burn-probability sit lower — a very different fingerprint than a single hazard map would suggest.
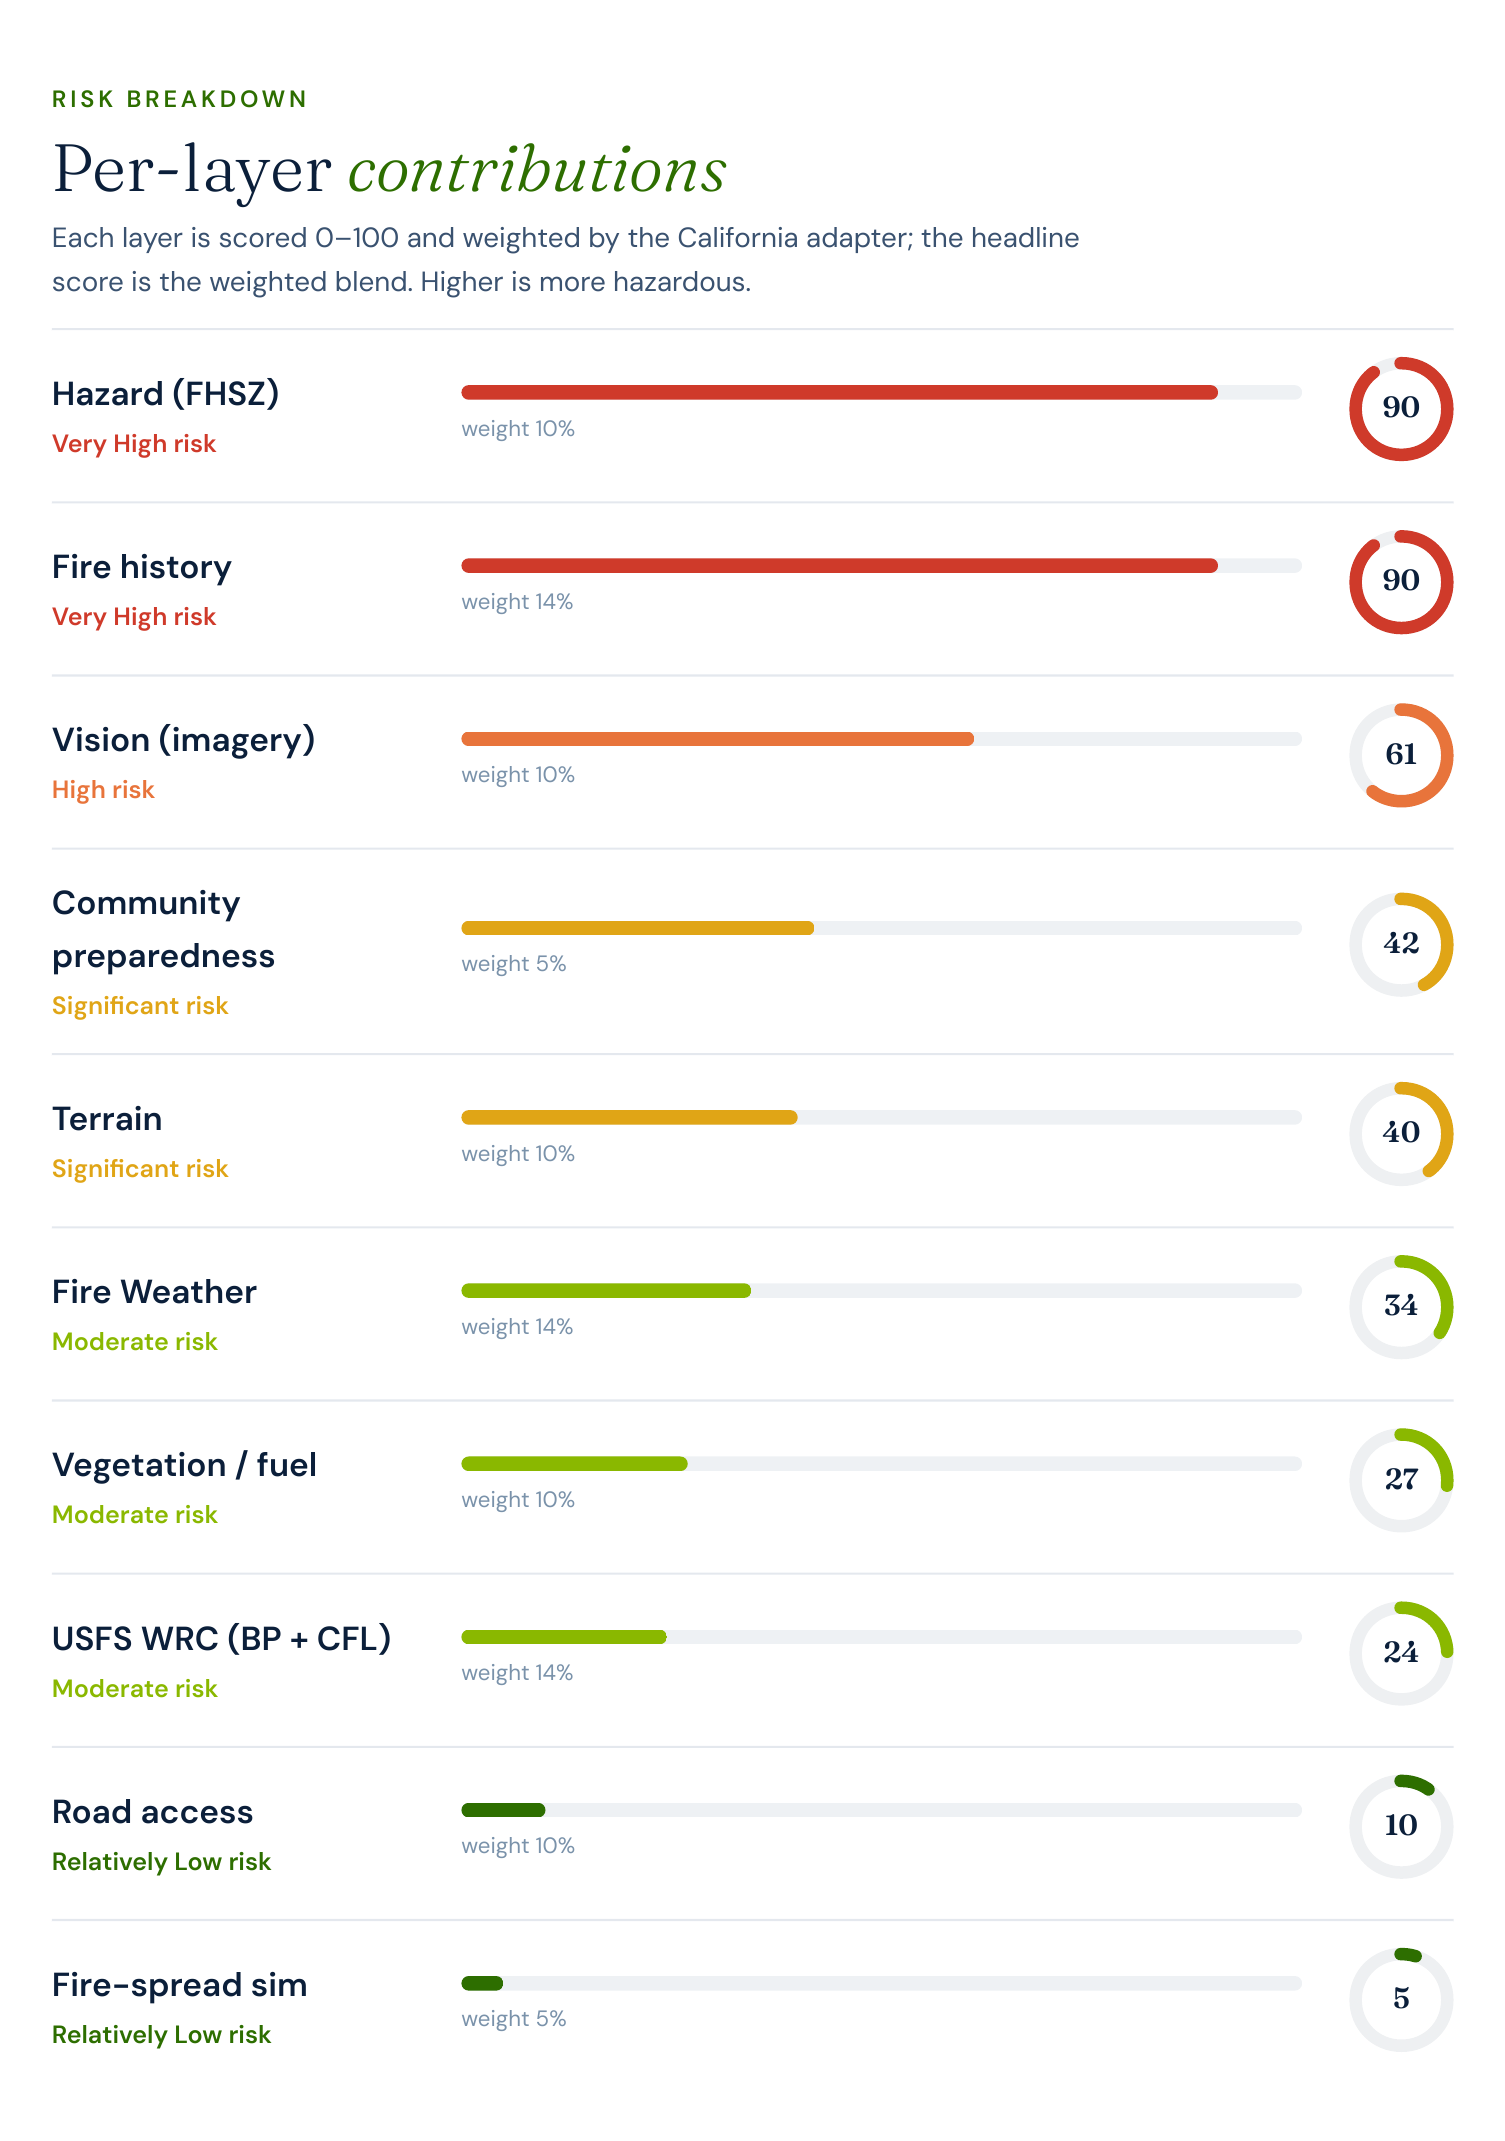
That contrast is the point most homeowners miss: a hazard polygon is a statement about jurisdiction and zoning rules, not a measurement of whether fire can reach a property. An “unmapped” parcel is not a safe one.
This river bottom has burned before — repeatedly
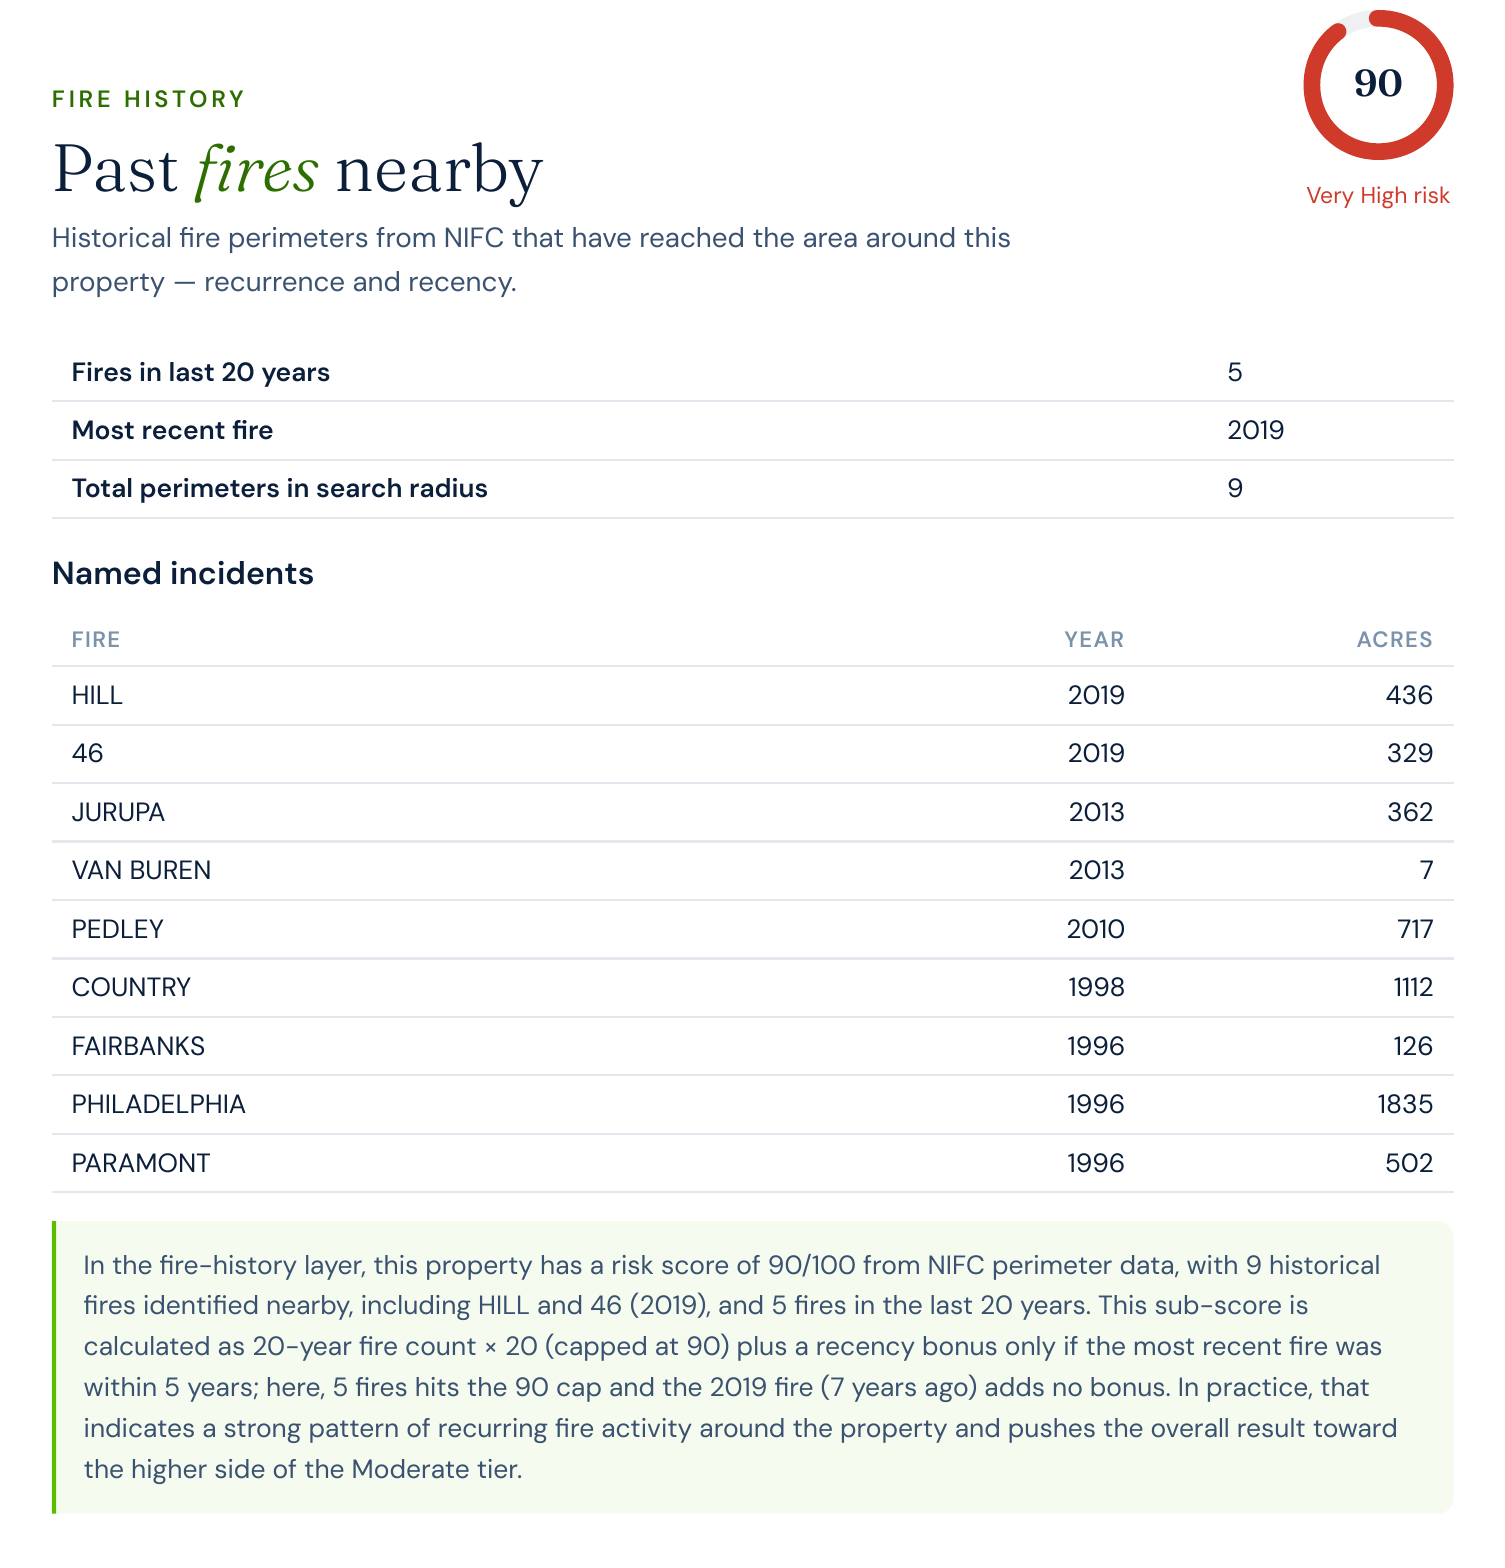
Satelife pulls the historical perimeter record at each address, and the Santa Ana River channel lights up: nine fires nearby, five in the last twenty years, scoring the fire-history layer a Very High 90.
Fire weather is structural here
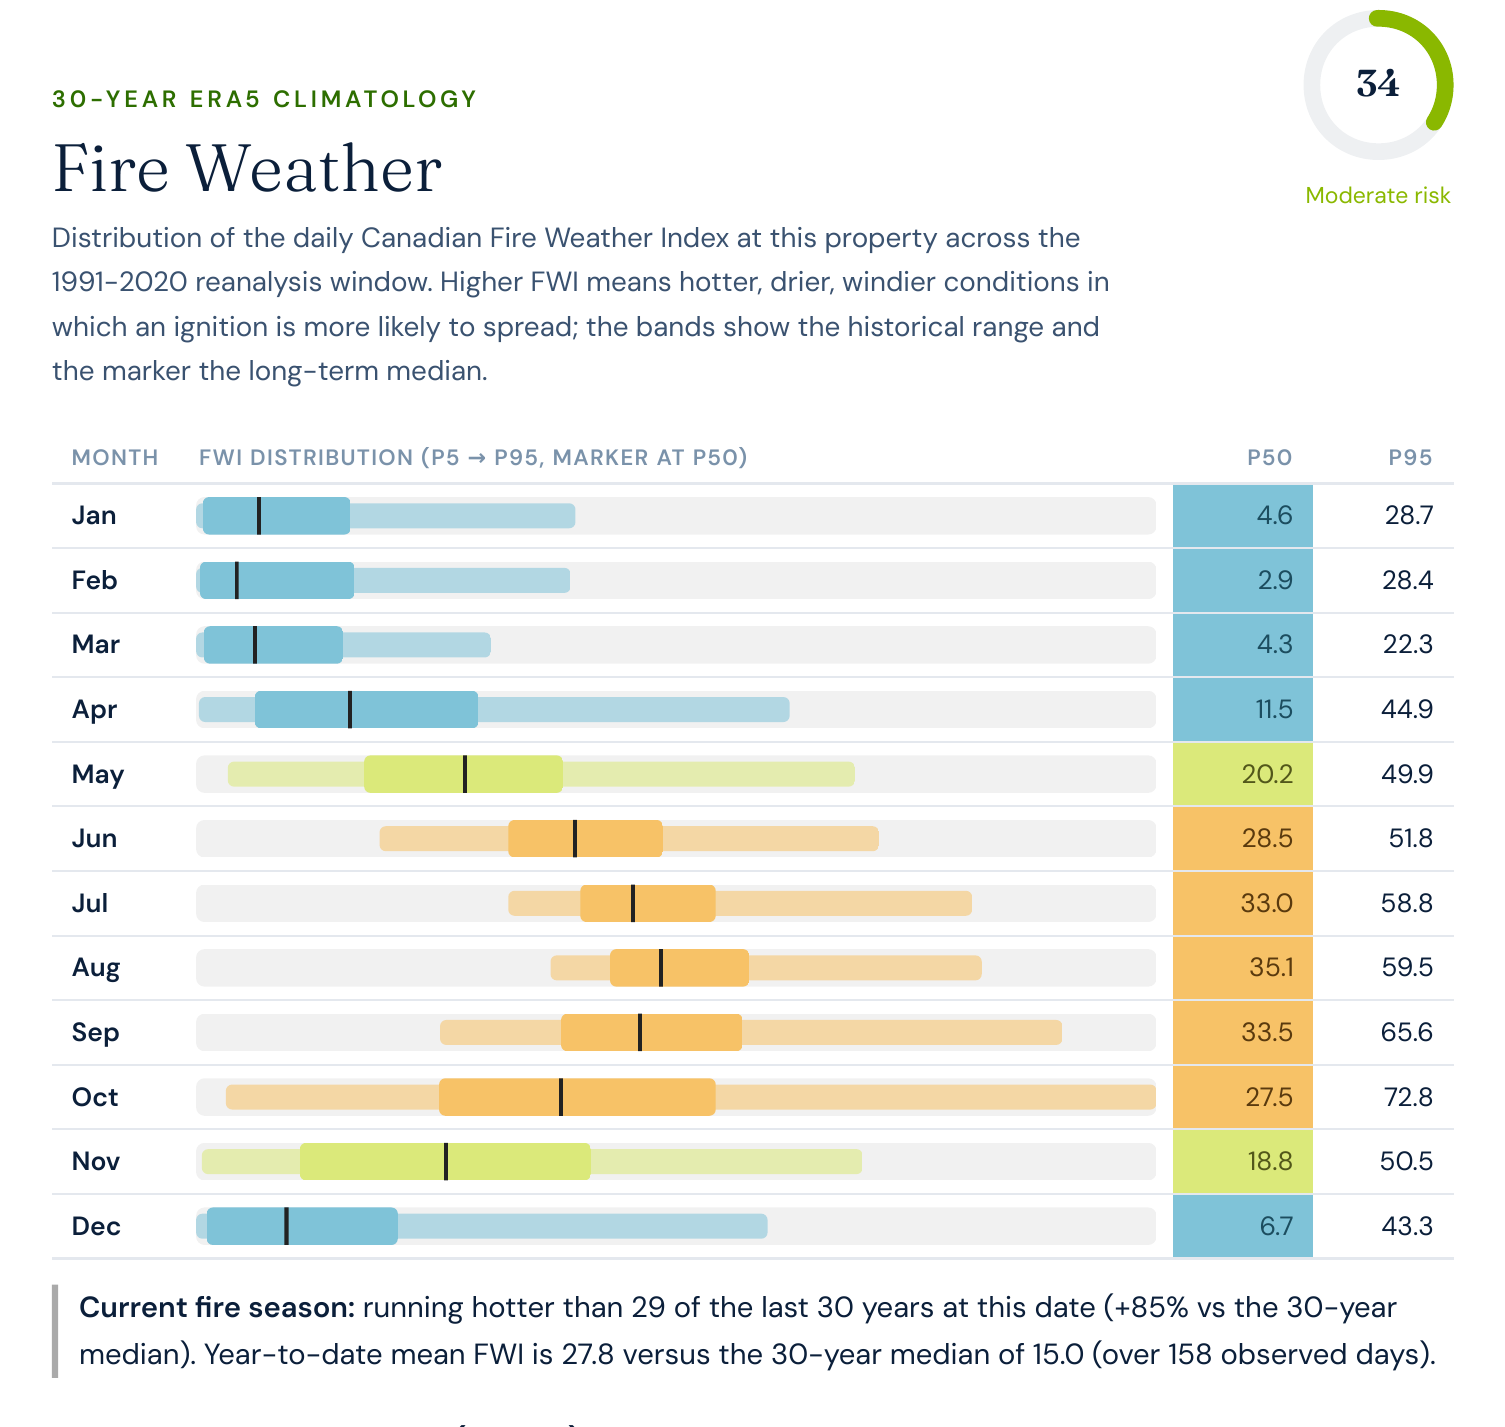
A 30-year climatology of the Canadian Fire Weather Index shows the danger isn’t random: FWI climbs through the August–November Diablo / Santa Ana season, with the 95th-percentile reading topping out near the 70s in October and current conditions running ~85% above the long-term median. Prevailing winds blow from the south-southwest, so ember exposure concentrates on north- and northeast-facing sides — exactly where defensible space pays off most.
Community preparedness: the live web-research layer
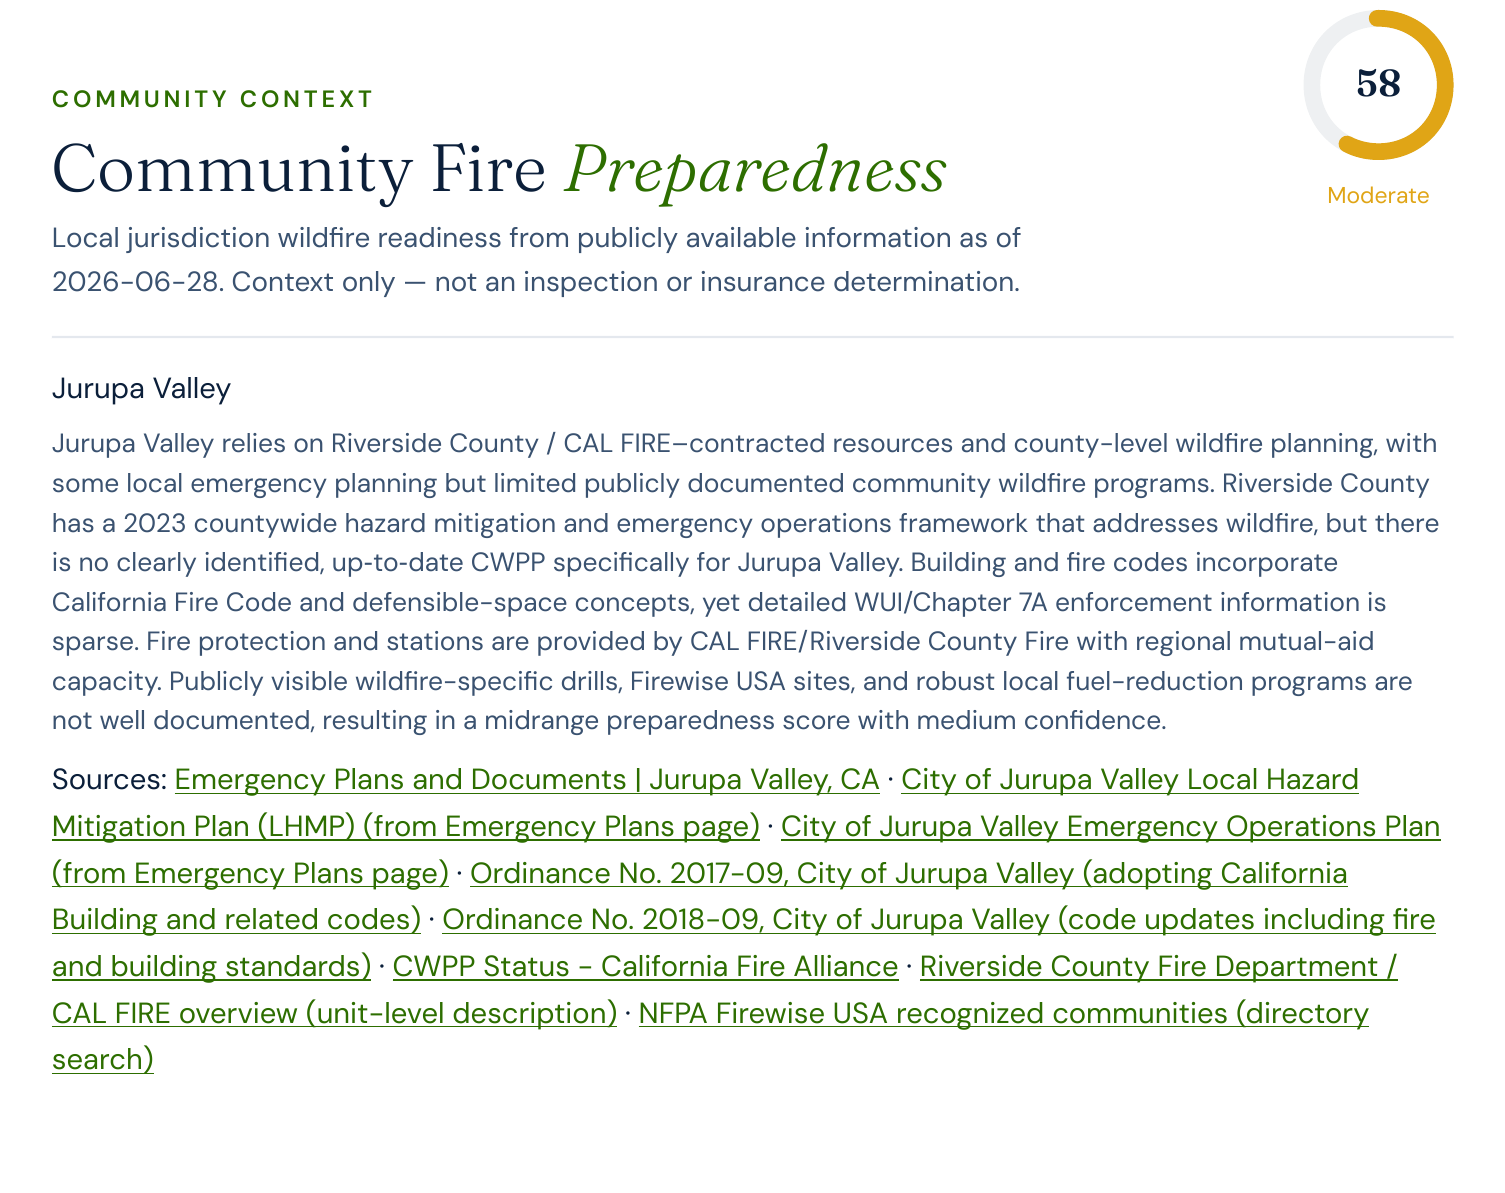
For this report we enabled Satelife’s Community Fire Preparedness add-on — a web-research pass that scores the local jurisdiction’s readiness from public sources (CWPP adoption, codes, fire-protection arrangements) on a 0–100 scale, with citations. Jurupa Valley landed at 58 — Moderate: county/CAL FIRE-contracted protection and a 2021 hazard-mitigation plan, but no stand-alone Community Wildfire Protection Plan. Pair that with FEMA’s Very Low community-resilience rating for these tracts, and the message is clear — preparedness is where households and agencies have the most leverage.
What this means for you
- A blank hazard map is not a clean bill of health. Across the river from a mapped Very High zone, Riverside parcels came back “unmapped” — yet the corridor has burned repeatedly and fire weather peaks near the 98th percentile each autumn.
- Plan around fire weather and embers. Treat August–November as a season, and harden the north/northeast (windward-ember) side first.
- Preparedness is the lever. With Moderate readiness and Very Low FEMA resilience, mitigation and insurance readiness matter more, not less.
Wildfire risk by ZIP code near the Bain Fire
Satelife scores wildfire risk one address at a time, but these are the ZIP codes along the Santa Ana River bottom where the Bain Fire burned and homes press against both banks. The point this article keeps making holds here: the score is computed for your parcel, not the ZIP, so two homes in the same ZIP can land in different tiers.
| ZIP code | Community | Why it is on the map |
|---|---|---|
| 92509 | Jurupa Valley | Bain Fire (2026) origin at Limonite Ave and Bain St (Rubidoux, Glen Avon, Pedley) |
| 91752 | Mira Loma | Santa Ana River-bottom WUI on the north bank |
| 92880 | Eastvale | River corridor upstream of the burn |
| 92503 | Riverside | La Sierra, across the river where evacuations were ordered |
| 92505 | Riverside | Arlanza, south-bank river-bottom interface |
Get a Satelife wildfire-risk report for your address
Every figure here is from a real Satelife wildfire-risk report — the same multi-layer, explainable assessment Satelife runs for any property. Get a report for your own address. It’s decision support, not a substitute for official evacuation orders or an insurer’s underwriting judgement.
Sources: CAL FIRE — Bain Fire incident; ABC7 and CBS Los Angeles; FEMA National Risk Index.
← All posts