This week’s signal: wildfire risk has gone fully operational
The week of 18–25 May 2026 made something clear for anyone who owns, insures or protects assets in fire‑prone regions: wildfire intelligence is no longer a seasonal reference map or a static hazard score. It’s a live operating system. In the United States, federal situational reporting on Friday, 22 May, logged 18 uncontained large fires nationwide, more than 5,000 personnel committed, and over 2.3 million acres burned year‑to‑date; notably, the Santa Rosa Island Fire in Channel Islands National Park reached 18,379 acres. These are not abstract statistics; they are live operational inputs that change the posture of insurers, municipalities and infrastructure operators in hours, not months. See National Interagency Fire Center (NIFC) National Fire News for Friday, 22 May. (nifc.gov)
What happened: four practical signals from the week
-
United States (Southern California): Alongside dynamic perimeters and satellite smoke imagery, agencies issued time‑stamped evacuation orders and air‑quality advisories; access and critical‑site monitoring were part of the picture. For the Sandy Fire near Simi Valley, CAL FIRE and Ventura County used rolling evacuation zones and repopulation guidance while South Coast AQMD issued smoke advisories; because of proximity to the Santa Susana Field Laboratory, agencies added air‑quality monitoring around the perimeter. For the Santa Rosa Island Fire, NASA and Copernicus imagery tracked growth as the incident expanded to tens of thousands of acres. Together these layers show why a perimeter or hotspot alone is not enough for operational decisions. Sources: CAL FIRE incident pages; City of Simi Valley updates; South Coast AQMD advisories; NASA Earth Observatory (Landsat 9); EU/Copernicus imagery of Southern California smoke plumes. (fire.ca.gov)
-
Portugal (pre‑season prevention): Authorities highlighted bulldozer access work, road clearance and inter‑agency command arrangements ahead of peak season, with helicopters and Black Hawks staged and municipal planning under way. This is the exact kind of pre‑season portfolio triage and mitigation prioritisation that European insurers and civil‑protection teams are scaling before fuels cure and offshore winds return. See Euronews’ on‑the‑ground prevention report published 20 May. (euronews.com)
-
Satellite and AI monitoring, validated as inputs: Near‑real‑time satellite fire products from EUMETSAT’s Sentinel‑3 FRP, operational imagery captured over Southern California, and Europe’s SWIFTT forestry programme (Horizon Europe) all advanced this month. States and utilities across the U.S. West continued rolling out AI‑enabled camera detection networks. Treat these as high‑value input layers—useful for verification, tasking and nowcasting—not the whole product. Sources: EUMETSAT FRP overview; EU/Copernicus “image of the day” for Southern California smoke; CORDIS/SWIFTT project factsheet; AP feature on AI fire‑detection cameras. (eumetsat.int)
-
Insurance and risk operations: State Farm’s 22 May guidance to homeowners emphasised year‑round readiness and mitigation, while California state actions earlier in May underscored regulatory pressure on claims handling and the continuing role of the FAIR Plan as market backstop. For risk leaders, the lesson is to shift from “one‑off rating” to explainable triage and verified mitigation evidence at the address and portfolio level. Sources: State Farm newsroom (22 May); California Governor’s 4 May statement on enforcement. (newsroom.statefarm.com)
Canada watchers will recognise the same operating stance: the Government of Alberta’s Wildfires of Note page and historical updates act as a shared, time‑stamped situational feed for municipal and provincial partners. (alberta.ca)
Why “satellite imagery alone” is not the product
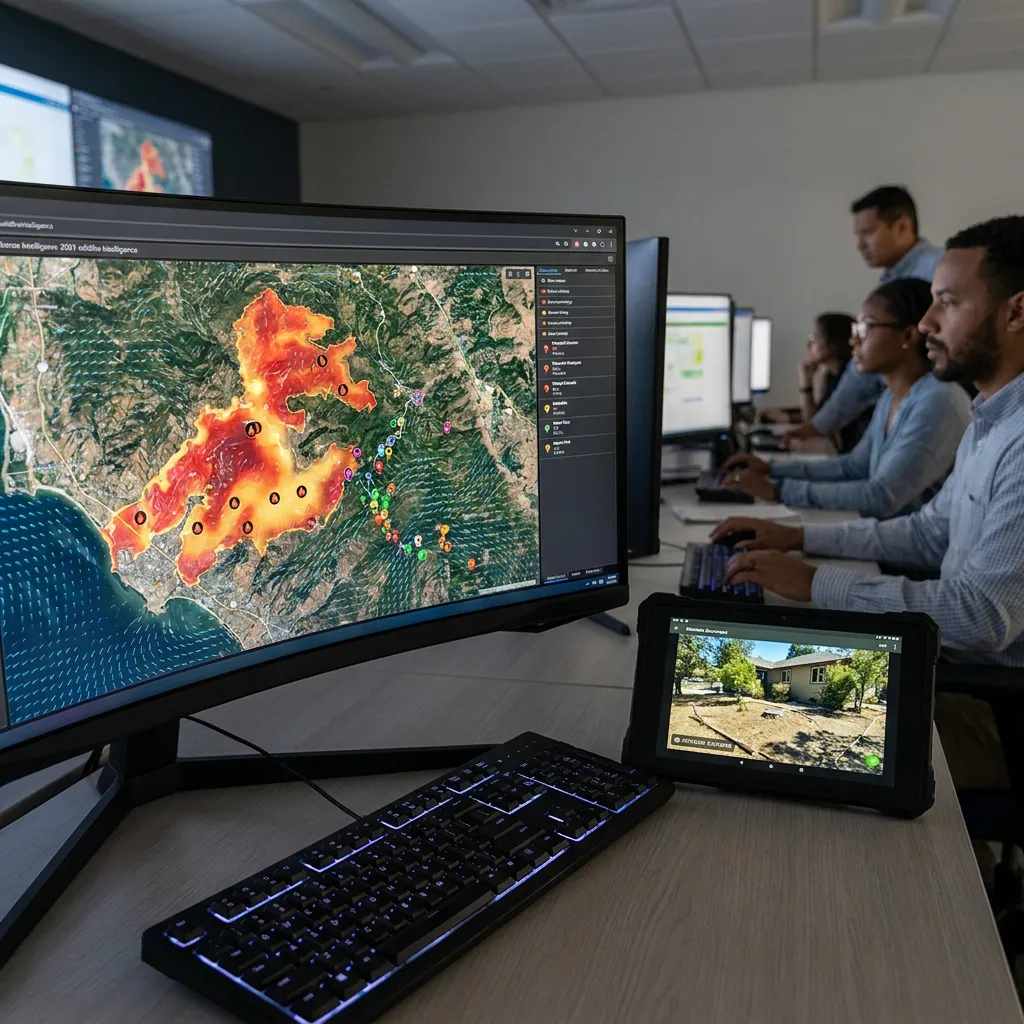
A single hotspot, a striking image from space, or a shapefile perimeter cannot answer the questions risk owners face in the first hour of an incident. Operational value emerges when multiple live layers are fused and time‑stamped:
- Active fire and smoke: satellite thermal detections and visible‑band imagery give confirmation, extent and spread vectors (e.g., Sentinel‑3 FRP and MODIS/Aqua captures during 15–18 May over Southern California). (eumetsat.int)
- Fire‑weather and wind: gusts, humidity recovery and lightning potential that change attack windows and exposure hour‑by‑hour (reflected in NIFC daily outlooks). (nifc.gov)
- Evacuation and access context: current orders, shelter locations, animal‑evacuation sites, and whether primary egress routes are open or smoky (Sandy Fire: Rancho Santa Susana Community Park, Ventura County Fairgrounds). (nbclosangeles.com)
- Critical sites and constraints: if the incident intersects hazardous or sensitive facilities (e.g., Sandy Fire proximity to Santa Susana Field Laboratory triggering monitoring). (fire.ca.gov)
- Exposed assets and infrastructure: which substations, feeders, water tanks, fibre routes or insured structures are within forecast impact bands.
- Mitigation evidence: defensible space, roof class, vents, home hardening features, and prior fuel‑reduction work captured and time‑stamped before a claim.
- Confidence and verification notes: imagery resolution, cloud/smoke occlusion, sensor latency, and cross‑checks with agency bulletins (e.g., AQMD releases). (southcoastaqmd.gov)
When these layers update live, they become a shared operating picture that underwriters, claims leaders, public‑works teams and incident command can all act on—with an audit trail.
How different users act on a live operating system
Insurers and portfolio risk teams
- Portfolio triage before and during season: surface books of business where fuels, slope and access present out‑sized loss potential this quarter; attach explainable drivers for each asset.
- Customer outreach and mitigation activation: when AQMD issues smoke advisories or CAL FIRE posts an update, trigger location‑based advice to customers on closures, safe‑egress and defensible‑space prep. (southcoastaqmd.gov)
- Claims readiness: auto‑assemble pre‑event property condition and mitigation evidence; link to official incident timestamps to accelerate fair claims settlement after an event (aligned with regulators’ emphasis on timely, transparent handling). (gov.ca.gov)
Municipal and civil‑protection teams
- Pre‑season prioritisation: Portugal’s approach—access clearing, inter‑agency command (CIPO), and targeted readiness—illustrates how to plan before the peak, including where to stage crews and heavy plant. (euronews.com)
- Live response: overlay satellite fire signatures with local wind forecasts, evacuation zones, and critical‑site buffers to direct traffic control, alerts and welfare checks.
Infrastructure and utilities
- Early detection and remote confirmation: use AI‑enabled camera networks as 24/7 sentries, with satellite detections as a second channel for verification and tasking. (ap.org)
- Grid‑hardening operations: fold the live fire picture into switching, recloser settings and asset inspections; PG&E’s monitoring centre and WMP describe this multi‑layer approach combining cameras, early‑fault detection and undergrounding. (investor.pgecorp.com)
Property and asset owners
- Readiness and hardening: follow insurer and standards‑body guidance on home inventories, non‑combustible zones and ember‑resistant construction, and subscribe to authoritative alerting apps. (newsroom.statefarm.com)
Satelife: the contextual product layer above sensors
Satelife.ai is a satellite wildfire intelligence platform built for address‑level and portfolio‑level decisions. We do not run a detection network; we fuse authoritative feeds and Earth‑observation with explainable, asset‑specific context:
- Fuels, terrain and structure exposure: slope, aspect, canopy continuity and radiant‑heat distances to assets.
- Access and egress: drive‑time analysis, choke points and alternate routes when closures are in force.
- Defensible space and home hardening: time‑stamped evidence of vegetation clearance, roof class, vents and outbuilding spacing.
- Weather and fire‑weather: near‑term wind and humidity windows aligned to likely fire spread and suppression opportunities.
- Confidence notes: sensor latency, cloud/smoke limitations, and verification against agency sources (e.g., NIFC, CAL FIRE, AQMD). (nifc.gov)
Our European adapters respect regional differences—Portugal is not California. For example, we tune access/egress models to local road standards and municipal command structures (CIPO), and we integrate EU Earth‑observation and forestry initiatives (e.g., SWIFTT) as validated layers. (euronews.com)
A concrete workflow risk owners can adopt today
- Monitor
- What to watch: live incidents within asset buffers; time‑stamped satellite detections; AQMD/health smoke advisories; evacuation and shelter updates; fire‑weather windows.
- Outcome: a single, shareable operating view refreshed on the hour. (southcoastaqmd.gov)
- Contextualise
- Fuse perimeter and imagery with access, egress, critical‑site buffers (e.g., SSFL), and asset overlays. Add weather and wind to anticipate spread corridors and flare‑up risks.
- Outcome: “so what” for each asset cluster, not just “where is the fire.” (fire.ca.gov)
- Prioritise
- Rank exposures by explainable drivers: fuels + slope + wind alignment + access constraints + lack of mitigation evidence.
- Outcome: a defensible list for outreach, patrols and pre‑positioning.
- Act
- Trigger customer messaging, deploy patrols to priority circuits, coordinate with municipal partners on closures and welfare checks, and prepare claims workflows.
- Outcome: measurable reduction in loss expectancy and time‑to‑response.
- Verify
- Capture before/after imagery and on‑the‑ground outcomes; record which advisories and orders applied, when and where; preserve mitigation evidence for renewal, claims and audits.
- Outcome: transparent, auditable decisions that stand up to regulators, reinsurers and boards.
Clear boundaries
Satelife supports decision‑making. We do not replace emergency agencies, formal evacuation orders, official hazard classifications or underwriting judgement. Our role is to surface explainable, time‑stamped intelligence—so that insurers can triage portfolios and evidence mitigation, municipalities can plan and protect, infrastructure operators can keep systems safe, and owners can prepare and recover.
Closing thought: from maps to workflows
The week’s incidents—from the Sandy Fire’s evacuation dynamics and critical‑site monitoring to the Santa Rosa Island Fire’s satellite‑verified growth, and from Portugal’s pre‑season access work to accelerating adoption of AI cameras and Copernicus/EUMETSAT products—show where wildfire intelligence is heading. It is a live operating system for risk owners: monitor, contextualise, prioritise, act, verify. If you are still relying on static hazard scores alone, you are under‑utilising the best tools now available. Sources: NIFC May 22 National Fire News; CAL FIRE and local government updates; NASA/EUMETSAT/Copernicus imagery; Euronews Portugal prevention coverage; AP on AI camera detection; State Farm homeowner readiness. (nifc.gov)
Selected references and further reading
- NIFC National Fire News (22 May 2026). (nifc.gov)
- CAL FIRE Sandy Fire incident updates and City of Simi Valley notices. (fire.ca.gov)
- South Coast AQMD smoke advisories (18–20 May). (southcoastaqmd.gov)
- NASA Earth Observatory: Santa Rosa Island fire imagery. (science.nasa.gov)
- EU Space/Copernicus image of the day: Southern California smoke plumes (18 May). (eu-space.europa.eu)
- EUMETSAT Sentinel‑3 FRP product overview. (eumetsat.int)
- CORDIS/Horizon Europe SWIFTT forestry project. (cordis.europa.eu)
- AP: States across the Western U.S. using AI for early detection. (ap.org)
- State Farm: Wildfire Risk is Expanding Beyond the West (22 May). (newsroom.statefarm.com)
If you manage wildfire exposure and want to see this live operating picture—in your addresses, circuits or assets—Satelife can help.
← All posts