Wildfires are getting larger, faster and more damaging. A fire‑spread simulation is a computer model that shows how a wildfire could move across the landscape over time. It helps planners and responders see where the fire might go next, how quickly it could spread, and which communities or assets are at risk. In simple terms: it is a “what‑if” map for fire behaviour, driven by weather, terrain and fuels.
By 2026, better satellite data, faster computing and modern AI will make these simulations more accurate and more useful. Below we explain the main modelling options, the data you need and where to get it, and how we do it at Satelife to turn an address into a clear, actionable scenario.
What drives fire spread? The basics in plain English
A wildfire’s movement depends on three things working together:
- Fuel: what can burn and how dry it is (grass, shrubs, or forest all burn differently).
- Weather: wind pushes flames; temperature and humidity change how easily fuels ignite.
- Terrain: slope acts like a ramp for heat; fires usually climb hills faster than they go downhill.
For fundamentals on fire behaviour, see the National Wildfire Coordinating Group and the U.S. Forest Service’s fire behaviour resources (both are widely used references by practitioners) NWCG and U.S. Forest Service fire behaviour.
The main modelling approaches in 2026
There is no single “best” model. Each approach trades off realism, speed and data needs.
- Physics-based/CFD models: use detailed heat, airflow and combustion physics. Most realistic, but slow and data‑hungry. Useful for site‑specific studies or critical infrastructure. A well‑known tool is NIST’s Fire Dynamics Simulator FDS.
- Cellular automata (CA): treat the landscape as a grid; each cell changes state (unburned → burning → burned) based on simple rules and its neighbours. Fast, easy to run, good for exploring many scenarios quickly. See an example study on CA for wildfires ResearchGate example.
- Empirical/statistical: fit patterns from past fires to predict spread rates by fuel and slope. Quick to run and helpful where long records exist.
- Machine learning/AI: learn relationships from large historical datasets (perimeters, weather, fuels) and update as new data arrive. Good for nowcasting and short‑term spread potential. See this research on AI for predictive modelling Google AI.
In practice, many teams blend approaches. For example, CA or empirical rules for rapid, regional‑scale “first looks,” and physics-based runs for complex local problems (e.g., canyons, wind channelling, or built‑up areas).
The data you need (and where to get it)
A useful simulation needs four ingredients: satellite imagery, weather, topography and fuel/vegetation maps. Here are commonly used, up‑to‑date sources referenced in the material:
- Satellite imagery and active fire detections
- NASA MODIS global fire activity and imagery NASA MODIS
- Copernicus Sentinel data for Europe (higher resolution optical and radar) Copernicus SciHub
- Weather
- National Weather Service Red Flag Warnings and fire‑weather forecasts in the U.S. NWS (API: api.weather.gov)
- Predictive outlooks from U.S. National Interagency Fire Center NIFC Predictive Services
- Terrain (topography)
- High‑resolution elevation and slope are crucial; these are integrated regionally in Satelife’s data stacks (see “How we do it at Satelife” below).
- Fuels/vegetation
- U.S.: LANDFIRE 2022 fuel layers (used widely in risk and spread modelling)
- Europe: Copernicus Land Monitoring and CORINE Land Cover underpin fuel/vegetation characterisation (see Copernicus above)
Historic fire perimeters and live nowcasts improve realism and help validate models:
- California: CAL FIRE perimeters and Fire Hazard Severity Zones CAL FIRE
- U.S.-wide supplement: NIFC Wildland Fire Open Data NIFC
- Europe: EFFIS (European Forest Fire Information System) nowcasts to feed hazard inputs EFFIS
For map making and scenario analysis, GIS tools remain essential:
How we do it at Satelife (step‑by‑step, in simple words)
Satelife is a European geospatial AI platform that turns an address into an at‑a‑glance wildfire risk report, complete with mitigation advice. Under the hood, we fuse authoritative datasets and run regional adapters for Europe and the U.S. The European stack uses Copernicus/EFFIS/CORINE; the U.S. stack leans on CAL FIRE and NIFC fire data plus established fuels and weather sources. Here is the simple flow we follow to prepare a spread scenario around a property:
- Locate the property
- We start from an address and place it precisely on the map. This anchors all analysis to the right parcel and surroundings.
- Build the local picture
- Terrain: slope and aspect strongly affect spread. We load high‑resolution elevation models where available.
- Vegetation/fuels: we classify nearby land cover and likely fuel types from CORINE/Copernicus in Europe and LANDFIRE in the U.S.
- Fire history and hazard: we add CAL FIRE/NIFC perimeters in the U.S. and EFFIS nowcasts and historic context in Europe to understand local fire patterns.
- Weather and wind: we ingest recent and forecast conditions (e.g., Red Flag Warnings, prevailing winds).
- Pick the right model for the job
- For fast, neighbourhood‑scale scenarios at address level, we usually run a cellular‑automata or empirical spread approach: quick, explainable and good for “what‑if” exploration.
- Where a site is complex (steep canyons, industrial sites, unique wind exposure), we can configure more detailed physics‑based analysis.
- Set the scenario knobs (parameters)
- Choose ignition point(s) and time.
- Set wind speed/direction and dryness (fuel moisture) based on current and forecast conditions.
- Optionally vary defensible‑space assumptions (e.g., if the homeowner removes vegetation within 30 metres).
- Run and map the spread
- The model steps forward in time and shows which cells could ignite, producing time‑stamped contours (e.g., 1 hour, 3 hours, 6 hours).
- We overlay the spread with exposure layers (homes, roads, utilities) and vulnerability (home hardening and defensible space indicators), consistent with Satelife’s Hazard × Exposure × Vulnerability framing for risk.
- Explain and export
- We summarise in plain language: “With 30 km/h winds from the north, the fire could reach the southern fence in ~2–3 hours. Clearing ladder fuels within 10 metres reduces this by X%.”
- Stakeholders can export maps for ArcGIS/QGIS or share a web link with responders and neighbours.
Running and visualising a scenario
If you are a practitioner:
- Use GIS to clip your inputs to a sensible extent (e.g., 10–20 km around the ignition).
- Choose CA or empirical runs for rapid “first‑pass” insights. Reserve physics‑based work for detailed, site‑specific analysis.
- Visualise outputs as time‑of‑arrival rasters and contour polygons. Keep symbology simple and legible.
If you are a homeowner or community leader:
- Satelife’s address‑level report brings this together for your property and explains practical steps. It highlights defensible space zones, nearby fuels and recent fire patterns so you can prioritise work.
Validating results and understanding limits
No simulation is perfect. Build trust through simple, routine checks:
- Back‑testing: compare modelled spread with historic perimeters from CAL FIRE or NIFC, and with European events in EFFIS.
- Sensitivity: nudge wind, humidity and fuel moisture to see how much results move. This highlights scenarios that hinge on uncertain inputs.
- Resolution limits: coarse imagery (e.g., some global products) can blur fine‑scale fuels. Consider Sentinel‑2 or national aerial imagery when detail matters.
- Communication: label maps clearly, include time stamps and parameter notes, and share caveats in plain English.
Common uncertainties include wind shifts, spot fires from embers, and sudden humidity changes. Treat outputs as decision support, not certainties.
Safety, operations and ethics (including photo licensing)
- Safety first: do not use a simulation to enter dangerous areas. Always follow official guidance and evacuation orders.
- Coordination: when sharing with fire services or councils, provide parameters, time of run and data sources so they can assess fit‑for‑purpose.
- Data licensing for photos: when adding images found via Google, ensure you have the right to use them. NASA imagery is generally public domain in the United States unless noted otherwise. Always credit the source page and the agency. Avoid reusing copyrighted news images without permission; link to them instead.
Three reference photos you can use
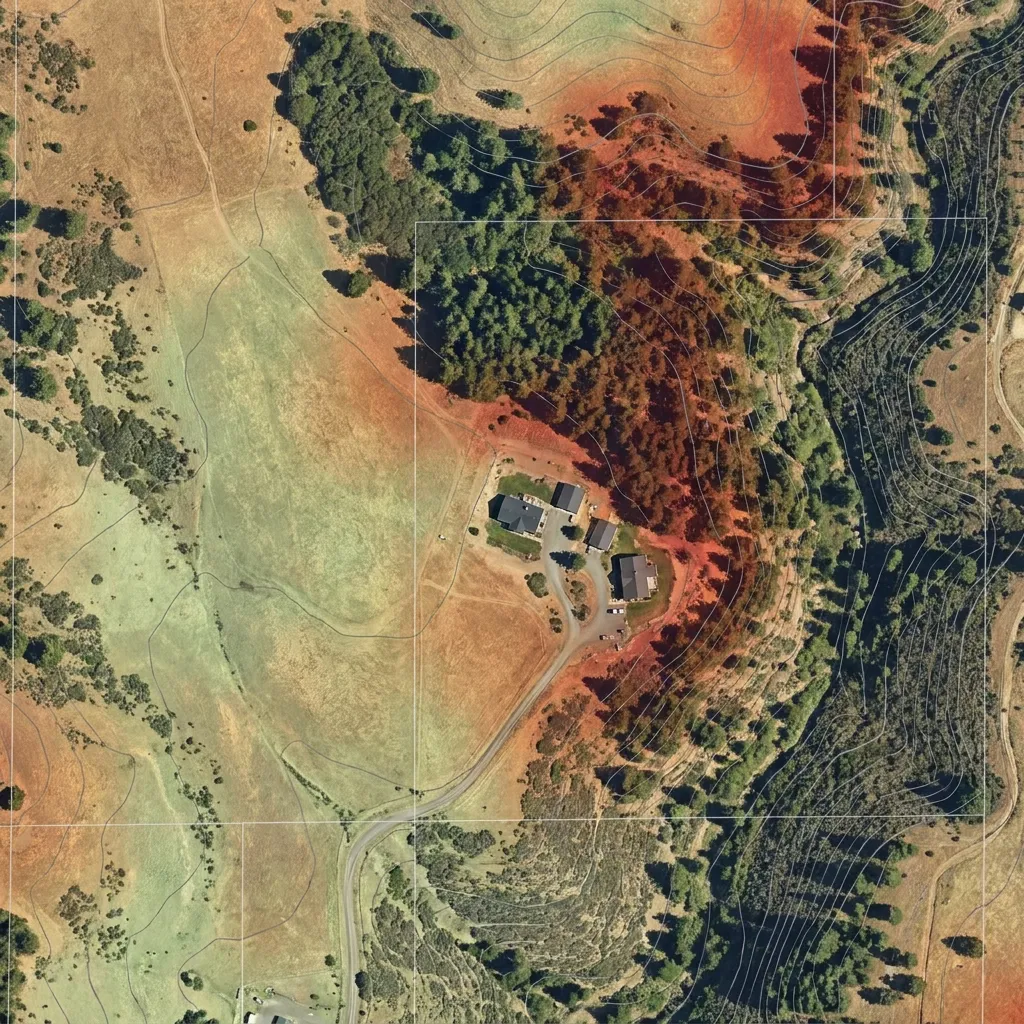
The following NASA images (discovered via Google Images) illustrate how satellites see wildfires. NASA content is generally public domain; still, include a credit and link to the source page.
-
Figure 1: Historic fires and smoke over the U.S. West Coast (September 2020). Credit: NASA Earth Observatory.
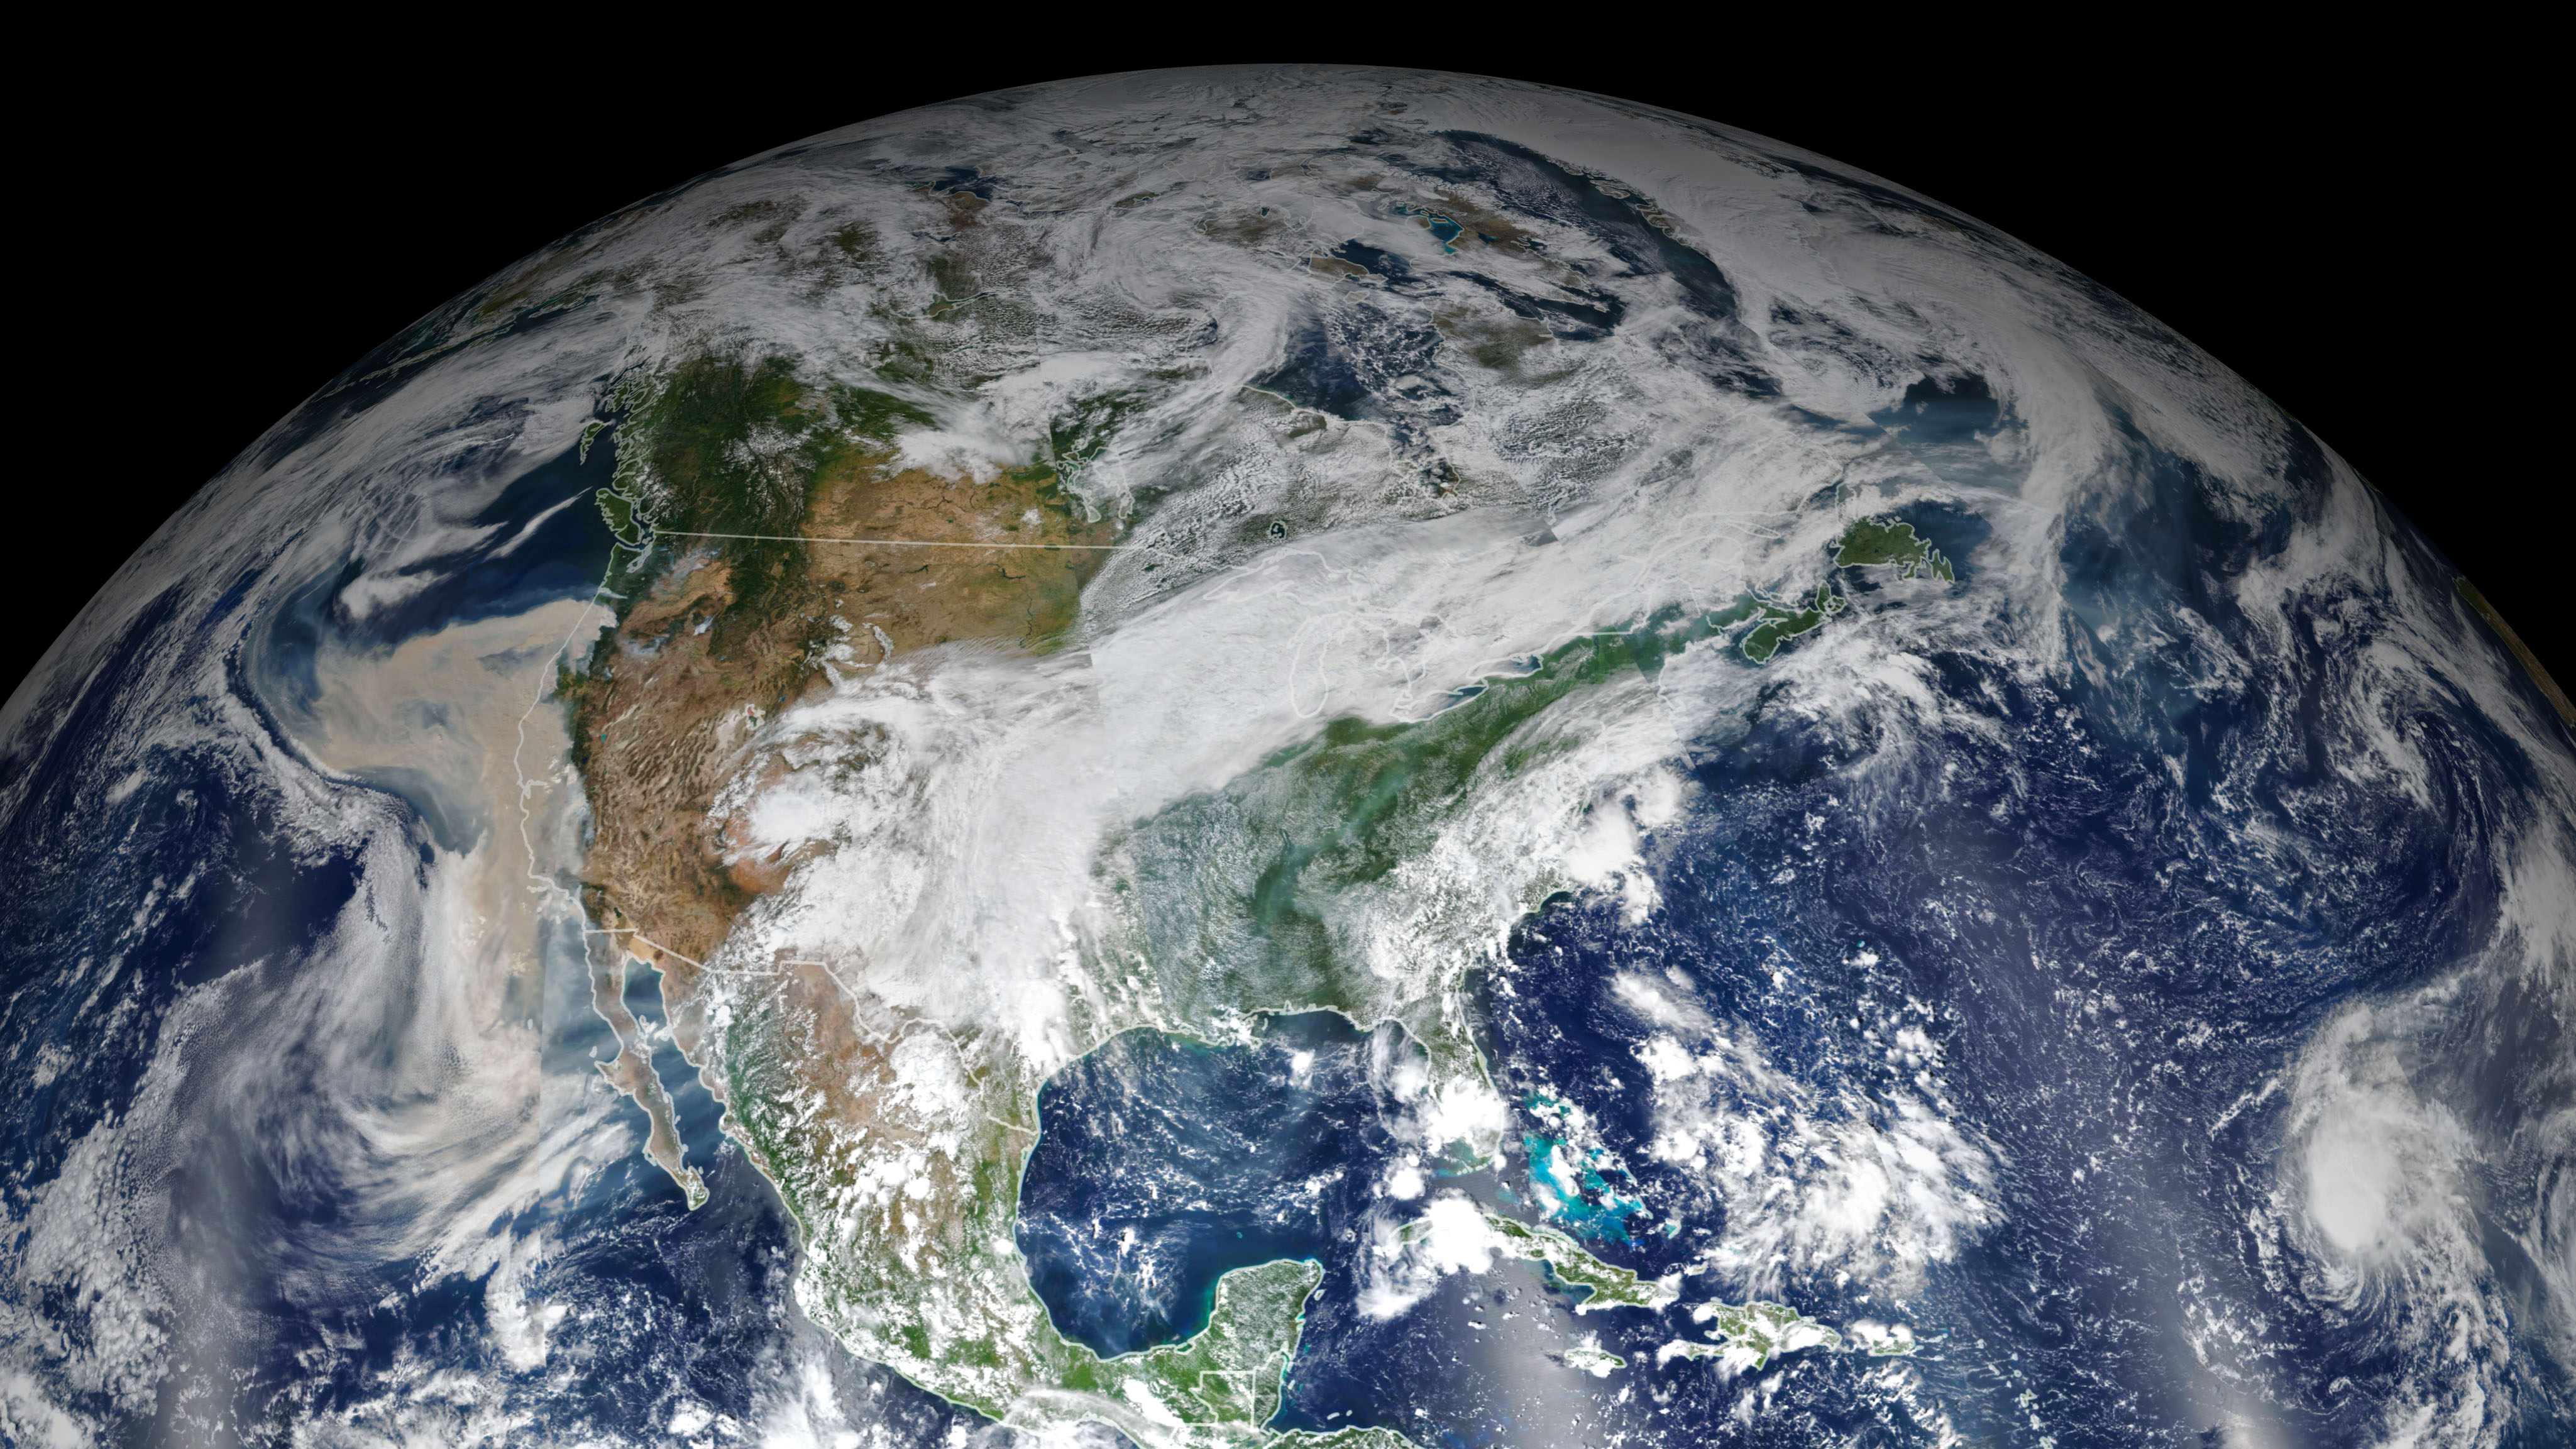
Source: NASA Earth Observatory article “Historic Fires Devastate the U.S. Pacific Coast” [NASA Science](https://science.nasa.gov/earth/earth-observatory/historic-fires-devastate-the-us-pacific-coast-147277/) -
Figure 2: August 21, 2020 – Fires in California, MODIS. Credit: NASA GSFC MODIS.

Source: MODIS Image Gallery entry “August 21, 2020 - Fires in California” [MODIS Web](https://modis.gsfc.nasa.gov/gallery/individual.php?db_date=2020-08-21) -
Figure 3: A wall of smoke on the U.S. West Coast (2020). Credit: NASA Earth Observatory.
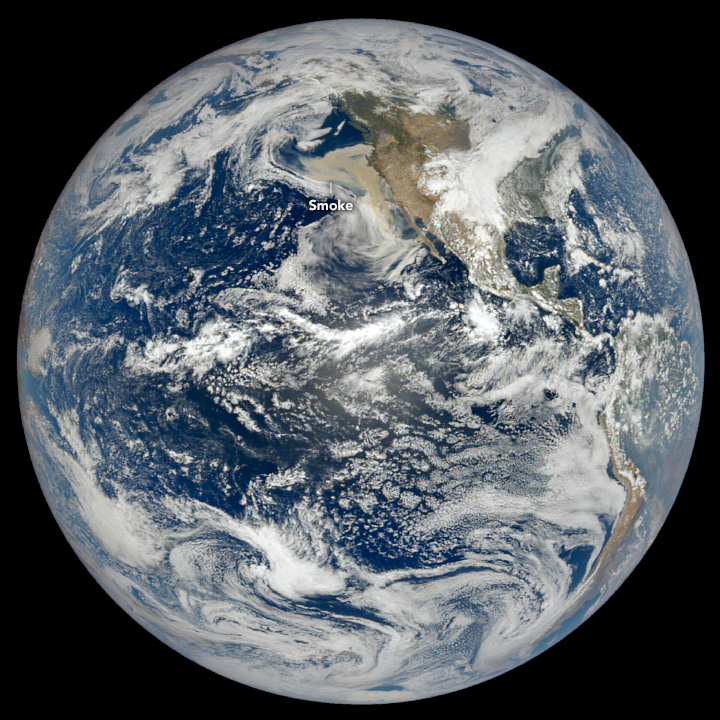
Source: “A Wall of Smoke on the U.S. West Coast” [NASA Science](https://science.nasa.gov/earth/earth-observatory/a-wall-of-smoke-on-the-us-west-coast-147261/)
Tools and resources at a glance
- Fire behaviour basics: NWCG, U.S. Forest Service
- Physics-based modelling: FDS
- Cellular automata example: ResearchGate
- AI for prediction: Google AI
- Satellite data: NASA MODIS, Copernicus Sentinel
- GIS: ArcGIS, QGIS
- Operational fire data: CAL FIRE, NIFC Open Data, EFFIS
Final word
In 2026, effective fire‑spread simulation blends the right model with the right data: satellites to see fuels and active fire, reliable weather, and realistic terrain. Satelife’s geospatial AI wraps these inputs around a specific address and adds clear, human‑readable guidance on defensible space and home hardening. The goal is simple: help people and organisations see what could happen next—and act early.
← All posts