---
title: "Simi Valley Wildfire Risk: What the Sandy Fire Reveals About Address-Level Scoring"
description: "The 2026 Sandy Fire shows why a blank hazard map isn't safety. See how Satelife scores Simi Valley wildfire risk address-by-address — fire weather, fuels, terrain and more."
image: "https://satelife.ai/images/blog/simi-valley-sandy-fire/hero-simi-valley-wui.webp"
canonical: "https://satelife.ai/blog/simi-valley-wildfire-risk-sandy-fire-property-score/"
date: "2026-06-21"
author: "Satelife Team"
---
# Simi Valley Wildfire Risk: What the Sandy Fire Reveals About Address-Level Scoring
On May 18, 2026, the **Sandy Fire** broke out south of Simi Valley and burned roughly 2,183 acres before it was contained nine days later. It destroyed one home, pushed evacuation orders across the Ventura–Los Angeles county line, and drew more than a thousand firefighters. For a fire that started on an ordinary spring morning — Simi Valley police reported a tractor struck a rock near the 2600 block of Rudolph Drive — it was a sharp reminder that this is fire country, even in places the official hazard maps leave blank.
That last point is the one most homeowners miss. A parcel can fall *outside* a mapped CAL FIRE Fire Hazard Severity Zone and still carry real, measurable wildfire risk. This article walks through what the Sandy Fire — and the federal risk record — tell us about wildfire risk in Simi Valley, and why scoring a property one address at a time beats reading a single zoning polygon.
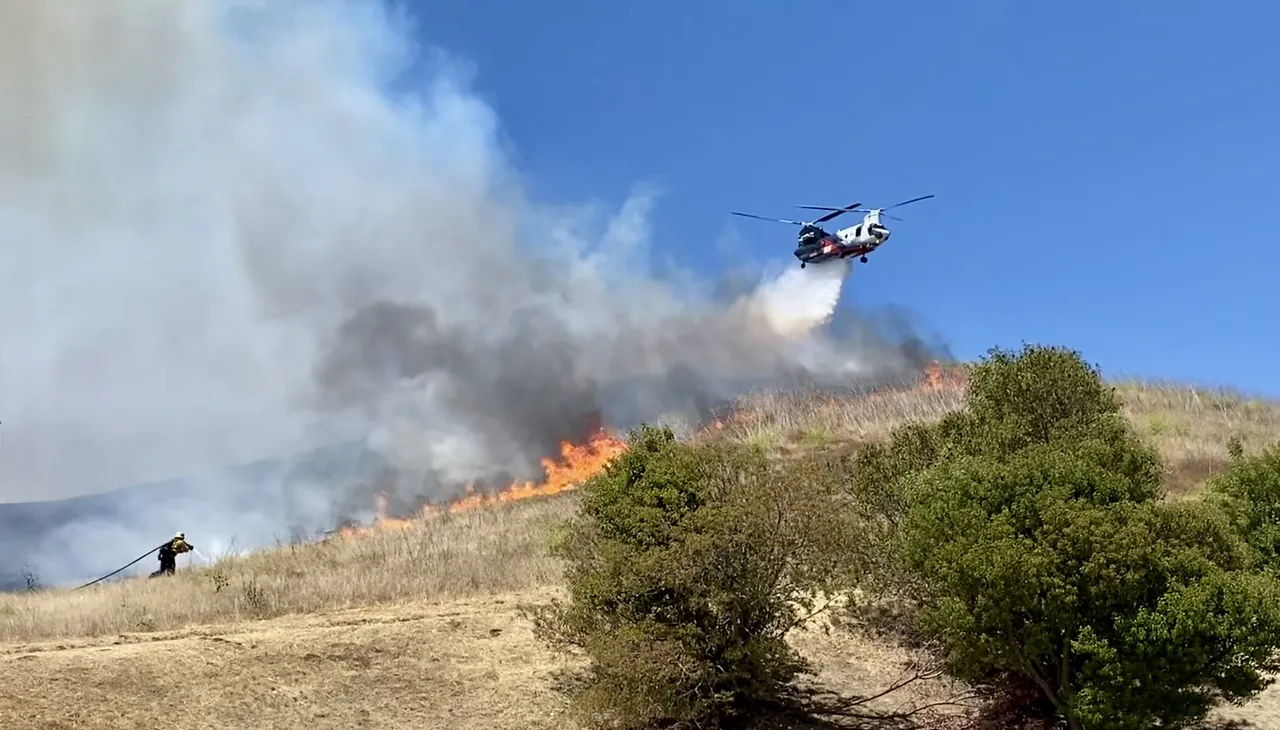
The Sandy Fire near Simi Valley, May 18, 2026. Credit: Keymusic88 / Wikimedia Commons (CC BY 4.0).
## The federal record already says "Relatively High"
Before looking at any single address, start with the federal baseline. FEMA's **National Risk Index (NRI)** scores every U.S. census tract for natural-hazard risk. For the Simi Valley tracts in our sample, the picture is consistent:
- **Wildfire risk: Relatively High**
- **Composite (all-hazard) risk: Relatively High**
- **Community Resilience: Relatively Low** — the modeled ability to bounce back is below the national average
- **Social Vulnerability: Relatively Moderate**
In other words, even where a specific parcel's hazard polygon reads "unmapped," the federal index still flags the surrounding community as **Relatively High** for wildfire. The static parcel map can be blank while the tract-level — and address-level — reality is not. That gap is exactly what address-level scoring is built to close.
## Geography: a valley pressed against fire-prone hills
Simi Valley sits in a basin ringed by the Santa Susana Mountains to the north and the Simi Hills to the south, with the Santa Susana Pass funneling toward the San Fernando Valley. It is a textbook **wildland-urban interface (WUI)**: neighborhoods of single-family homes run right up against dry chaparral, coastal sage scrub, and grassland that cures to tinder by late summer. When seasonal winds align with that fuel, fire moves fast — and the homes are in the way.
## Why the official hazard maps come back blank here
The blank isn't a Satelife quirk — it is how the upstream hazard datasets are built. Two layers most people treat as authoritative simply don't draw a line on many Simi Valley parcels, and the reasons have nothing to do with how safe the property is.
**CAL FIRE's Fire Hazard Severity Zones (FHSZ) are a zoning product, not an address risk score.** The state is only required to map Moderate, High, and Very High zones across the *State Responsibility Area* — the unincorporated wildlands CAL FIRE protects. Incorporated cities like Simi Valley fall under the *Local Responsibility Area*, where the long-standing maps delineated **only the Very High zone**. Everything below that threshold was simply never drawn. So a home that isn't inside a Very-High polygon comes back "unmapped" — meaning *not classified for building-code purposes*, not *not exposed to fire*. California is now extending LRA mapping to Moderate and High zones under SB 63 and AB 211, but that rollout is recent and parcel coverage is still uneven.
**The USFS burn-probability model treats neighborhoods as non-burnable.** Wildfire Risk to Communities derives burn probability from thousands of wildland-fire simulations run on a coarse 270 m grid. Developed land is coded as "non-burnable" in the underlying LANDFIRE fuels, so the simulated fires don't spread into housing — and the modeled burn probability over a built-up parcel can read near zero. Yet wind-driven embers routinely ignite homes deep inside the built footprint; the model's blind spot is precisely where most structures are actually lost.
In short, a missing FHSZ polygon or a zero burn-probability pixel describes a **gap in the map**, not an absence of risk. That is exactly why Satelife scores the address across many independent layers and reweights when one is silent — so an unmapped hazard layer no longer drags the result down as a false zero.
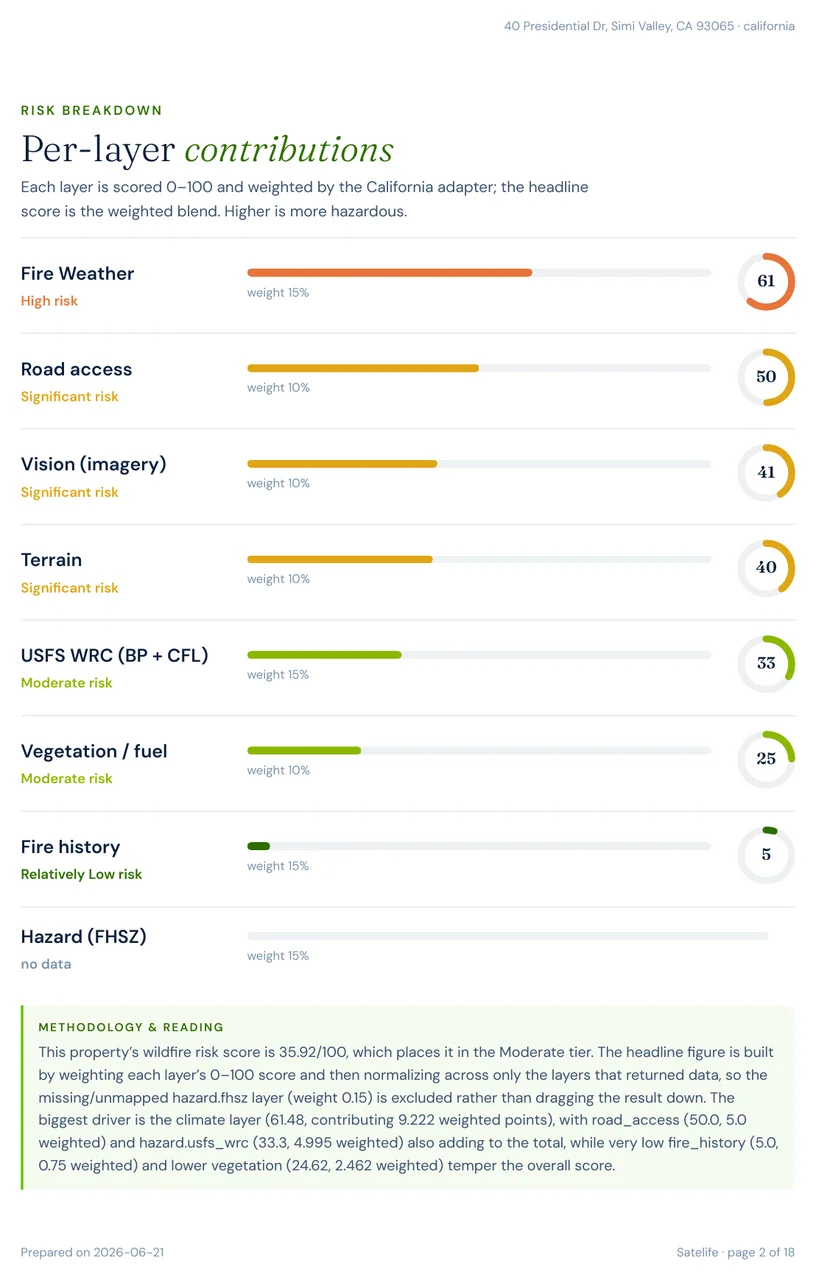
You can see it in the per-layer breakdown for a real Simi Valley address: fire weather dominates, the FHSZ layer is unmapped — and the weighted evidence still lands on a meaningful Moderate score.
Per-layer breakdown for 40 Presidential Dr, Simi Valley. Fire weather leads; the FHSZ hazard layer shows no mapped signal.
## Fire weather is the structural driver here
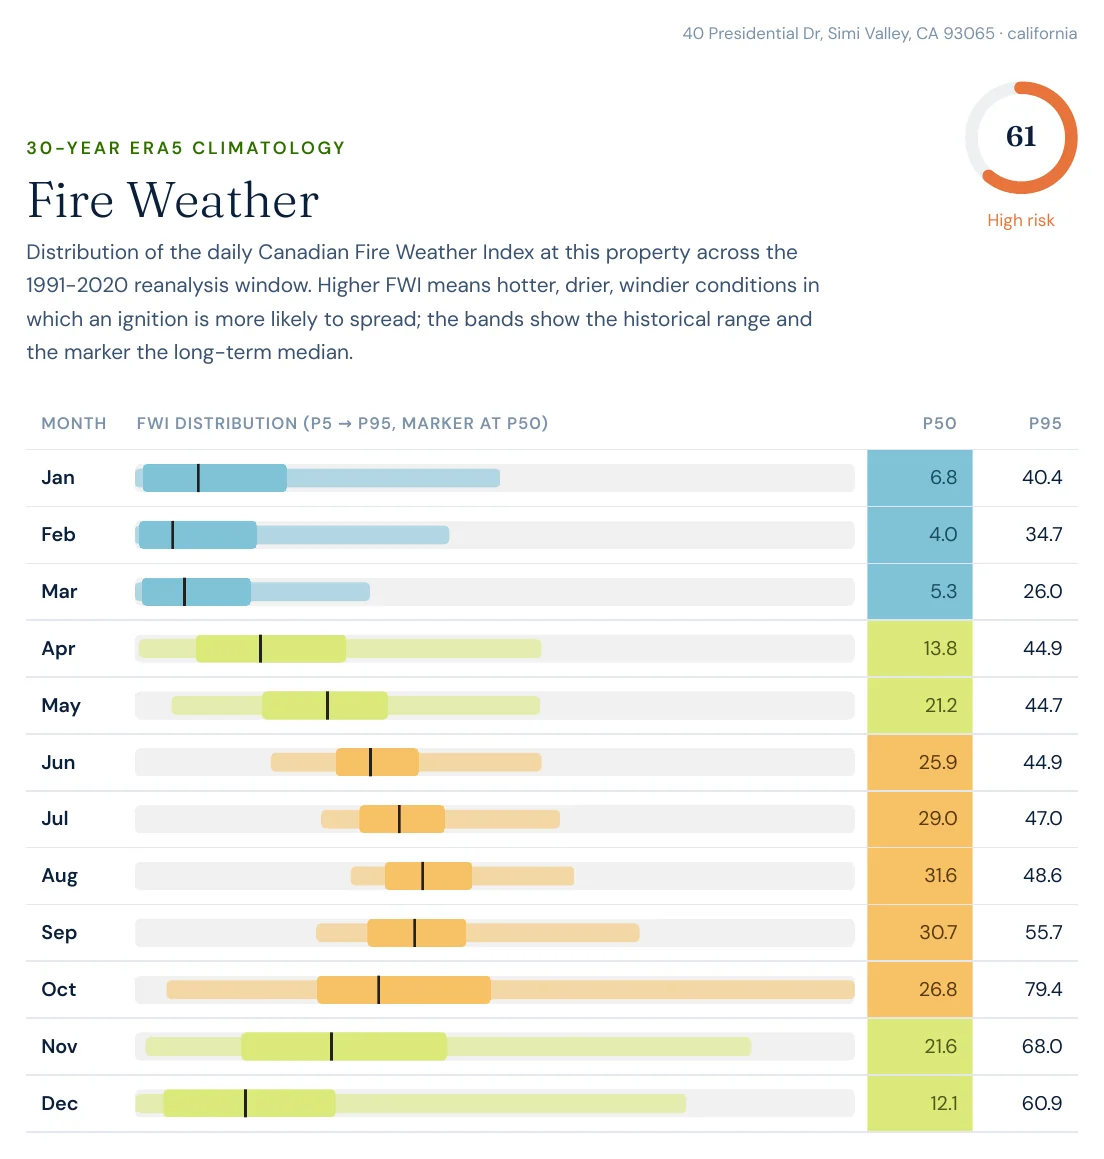
If one factor defines Simi Valley's risk year after year, it is fire weather. Satelife's deep fire-weather analysis uses a 30-year climatology of the Canadian Fire Weather Index (FWI) at the exact coordinates. The pattern is unmistakable: FWI climbs sharply from **August through November — the Diablo / Santa Ana season** — with peak monthly values reaching the ~98th percentile and October readings near the top of the chart.
30-year monthly fire-weather (FWI) distribution. The autumn peak coincides with the region's worst wind-driven fire days.
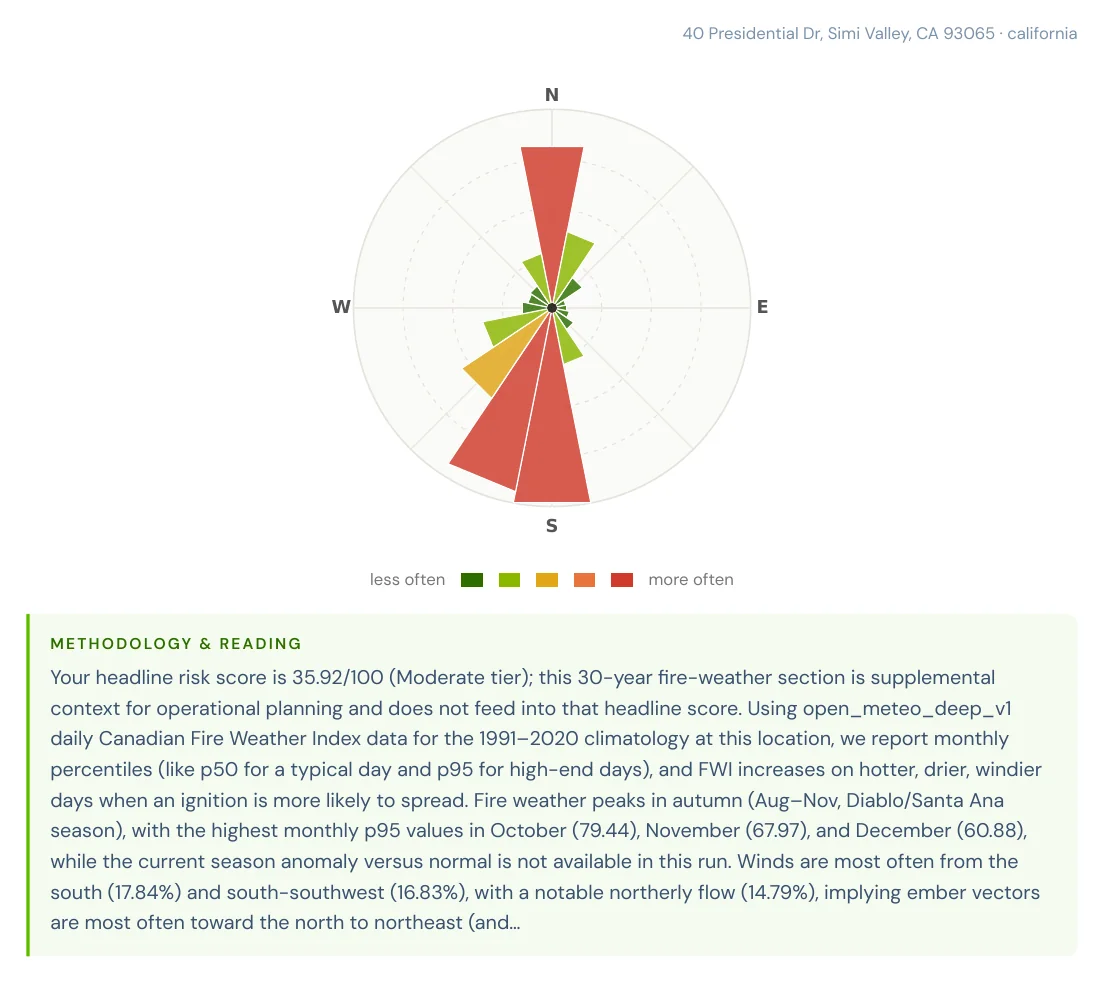
Wind direction matters just as much as wind speed. The 30-year wind rose shows the prevailing flow most often from the **south (≈18%) and south-southwest (≈17%)**, with a notable northerly component (≈15%). For a homeowner, that translates into a practical instruction: ember exposure tends to concentrate on north- and northeast-facing slopes, so that is where defensible space and home hardening pay off most.
Annual wind rose. Prevailing south/southwest winds imply ember vectors toward the north and northeast.
## Terrain: foothills that feed the fire upslope
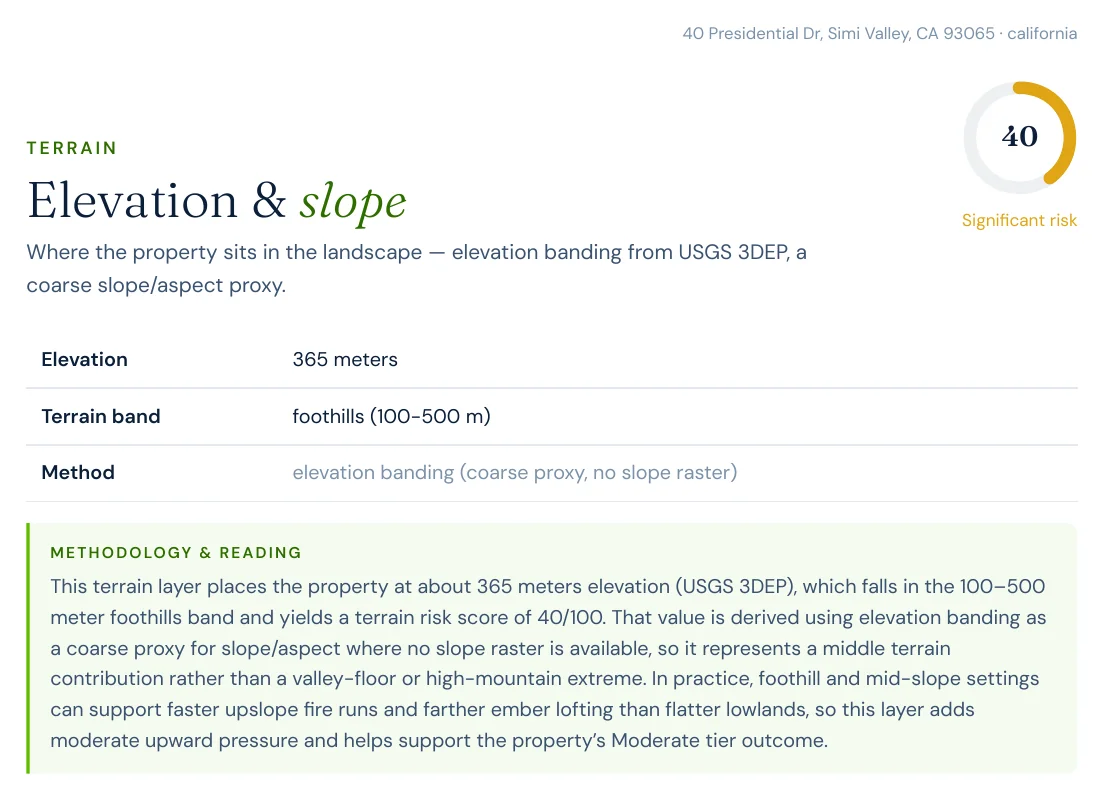
Where a home sits in the landscape shapes how fire behaves around it. Satelife reads elevation from USGS 3DEP as a slope-and-aspect proxy. The Reagan Library address sits at about 365 m — squarely in the 100–500 m **foothills band** that rings Simi Valley — and scores 40/100, a "Significant" terrain contribution. That middle ground matters: fire runs faster uphill, and slopes loft embers farther ahead of the front than flat valley floor does. The canyons and saddles of the Santa Susana Mountains also funnel and accelerate the seasonal winds, steering fire straight toward the homes built along the interface.
Terrain panel for 40 Presidential Dr — foothill elevation (USGS 3DEP) adds upslope and ember-lofting pressure.
## Two addresses, two stories
### 40 Presidential Dr — the Reagan Library ridge
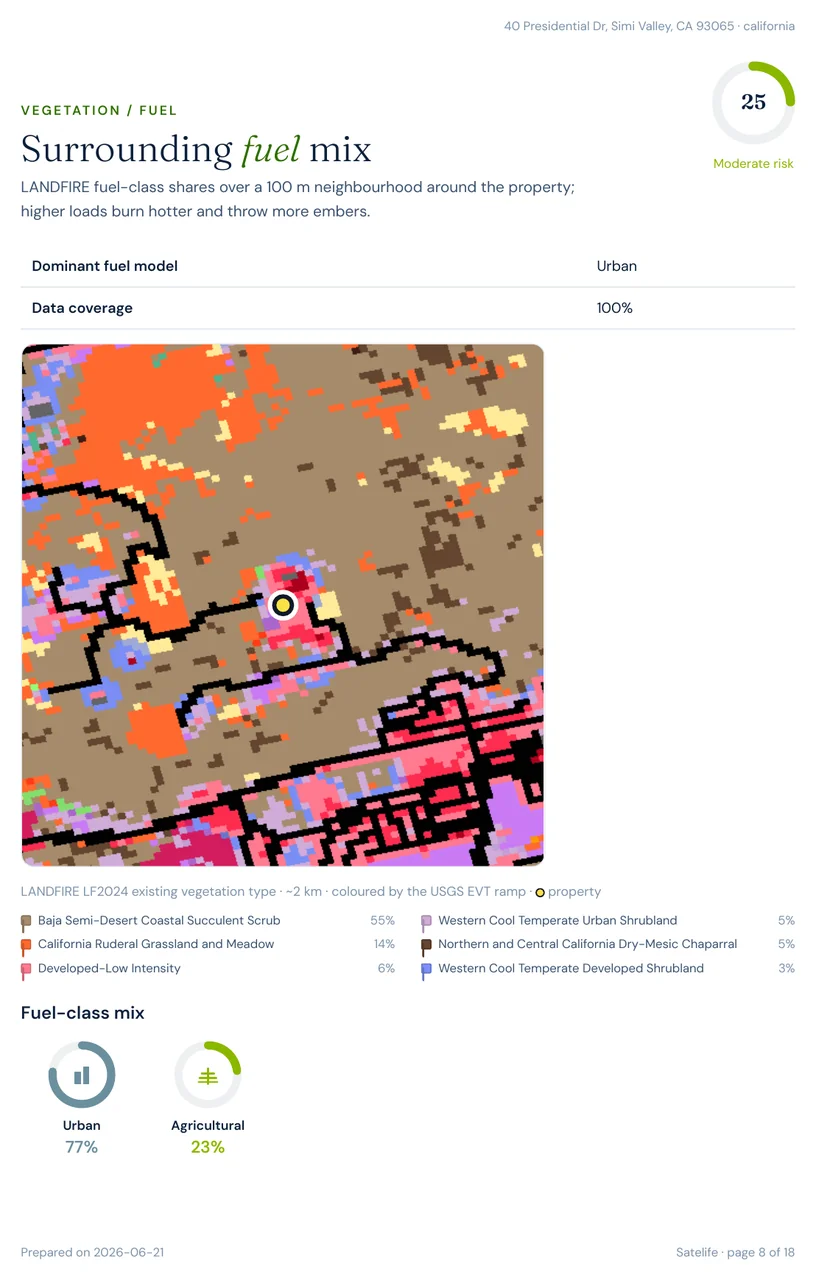
The Ronald Reagan Presidential Library sits on an exposed ridge that the **Easy Fire of 2019** burned right up to, forcing the evacuation of some 26,000 residents. Satelife scores the address **35.9 / Moderate** (confidence 0.90). Fire weather is the top contributor at ~61 (High), road access scores comparatively well, and the FHSZ layer is unmapped. The surrounding fuel map shows why the number holds up: the campus sits in a mosaic of developed land and continuous wildland fuels — grassland, coastal sage scrub and chaparral — draped across the open slopes.
LANDFIRE surrounding fuel mix at 40 Presidential Dr — developed parcels ringed by continuous wildland fuels.
### 2600 Rudolph Dr — the Sandy Fire's doorstep
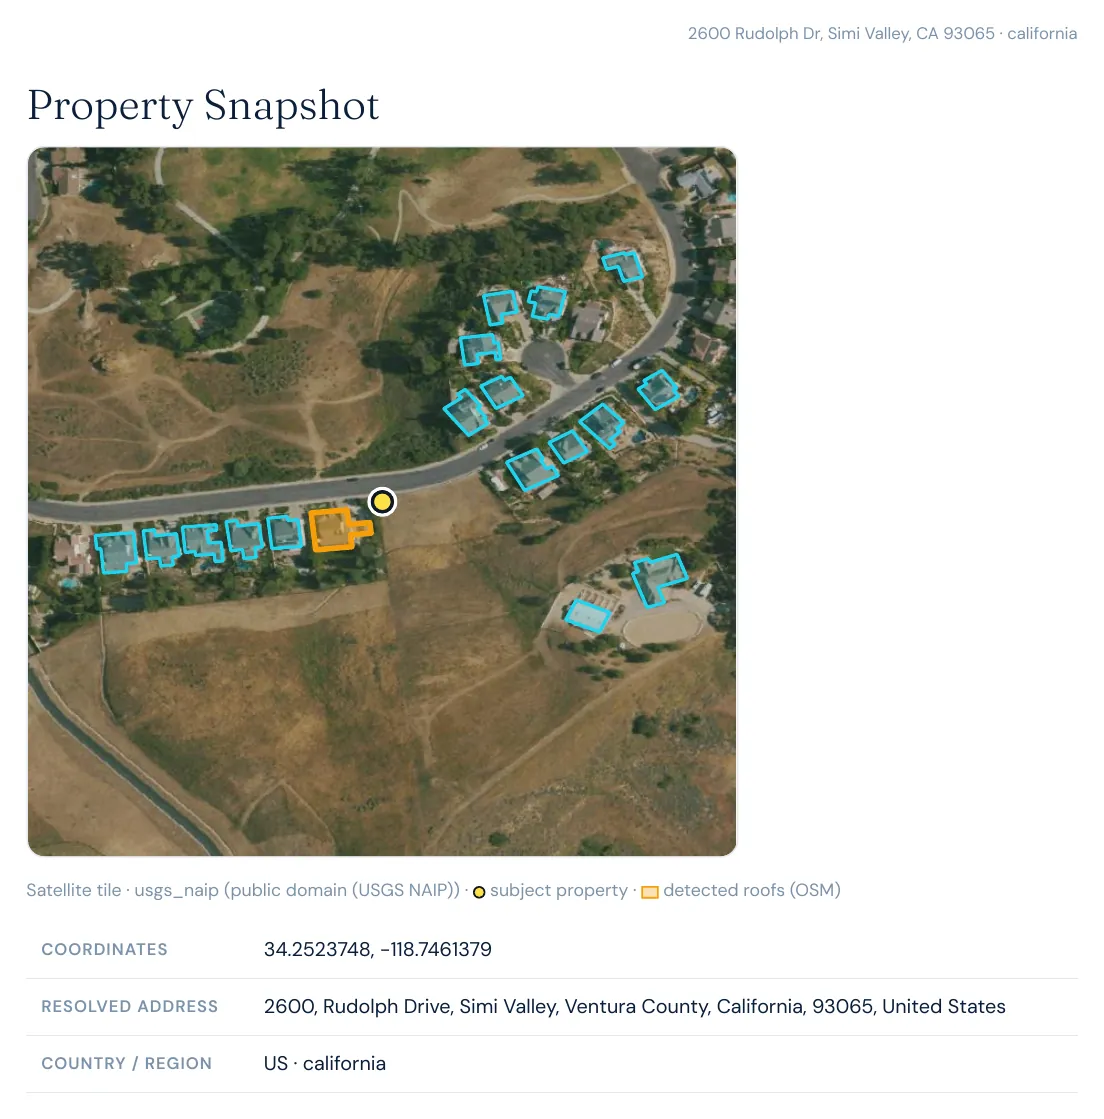
The 2600 block of Rudolph Drive is the reported ignition vicinity of the Sandy Fire itself. Satelife scores it **37.4 / Moderate** (confidence 0.85), again led by elevated fire weather (~62) and a higher USFS WRC contribution. Satelife's property imagery overlays OpenStreetMap-detected building footprints on USGS satellite tiles, pinning the exact structures in play — here, a dense residential pocket pressed against the open hills where a single roadside spark grew into a 2,000-acre incident.
Satelife property imagery for 2600 Rudolph Dr — USGS satellite with OSM-detected building footprints and the subject parcel marked.
## This interface has burned before — repeatedly
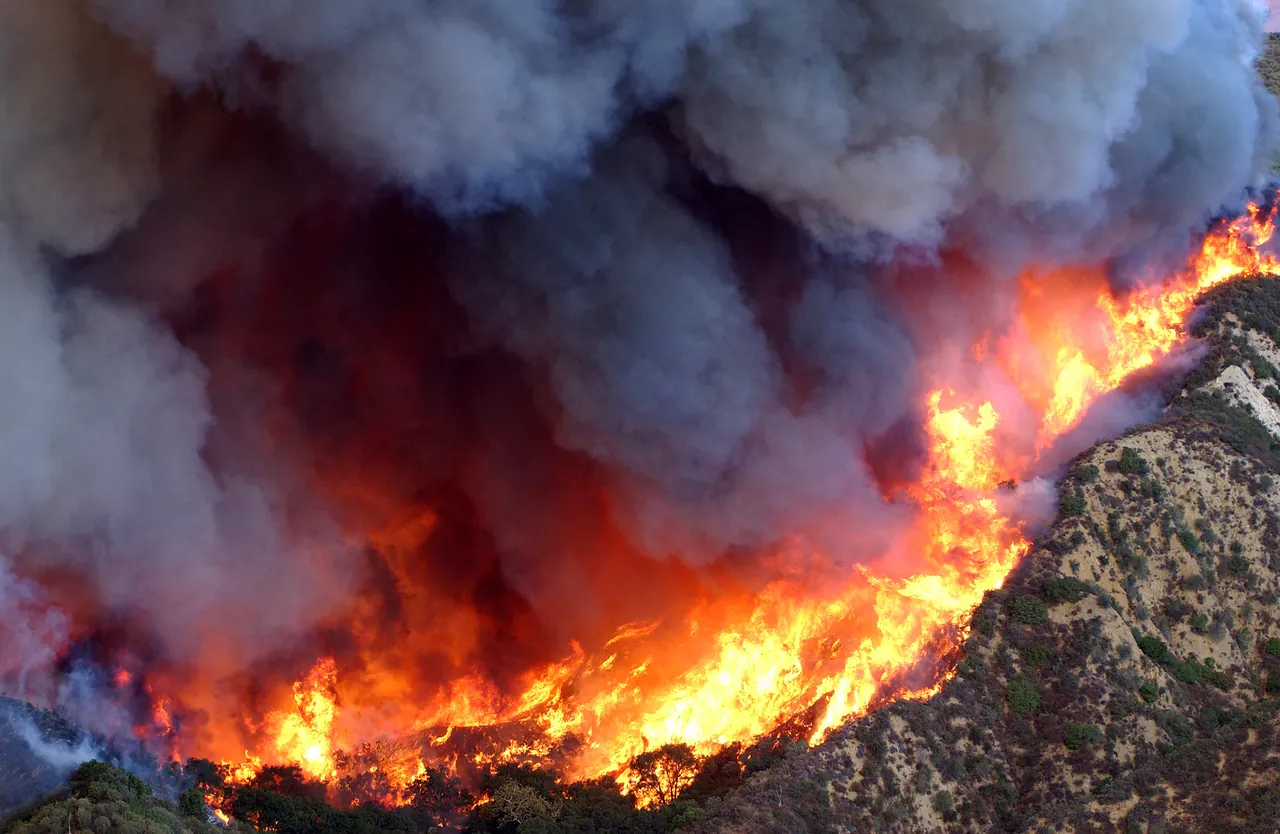
The Sandy Fire is the latest entry in a long ledger. The same hills have produced the **Easy Fire (2019, ~1,806 acres)**, the **Topanga Fire (2005, ~24,175 acres in the Santa Susana Mountains)**, and the **Simi Fire (2003, ~108,204 acres)** across the Simi Hills and southeastern Simi Valley. History rhymes here.
A wildfire above Simi Valley. Credit: U.S. Air Force photo by SMSgt Dennis W. Goff (public domain).
It is worth noting that Satelife's own *fire history* layer returned zero perimeters within its tight local search radius for these specific parcels — a clean illustration of the article's theme. A single layer can read "zero" while the regional record is substantial. No one layer is the whole story; the weighted, multi-layer score is.
## What this means for you
1. **A blank hazard map is not a clean bill of health.** Many Simi Valley parcels sit outside a mapped FHSZ polygon, yet FEMA rates the tract Relatively High and fire weather runs in the ~98th percentile each autumn. Absence of a zone is not absence of risk.
2. **Plan around fire weather, because it is structural.** The Diablo / Santa Ana window (August–November) is when ignitions spread fastest. Treat it as a season, not a surprise.
3. **Harden the windward side first.** With prevailing south/southwest winds, prioritize defensible space and ember-resistant detailing on north- and northeast-facing exposures.
4. **Prepare for a slower recovery.** FEMA's Relatively Low community-resilience score means mitigation and insurance readiness matter more, not less.
5. **Act before the next event.** Explainable, address-level scoring gives homeowners, agents, and insurers something to act on ahead of time — instead of reacting after the smoke clears.
## Wildfire risk by ZIP code near Simi Valley
Satelife scores wildfire risk one address at a time, but these are the Simi Valley-area ZIP codes where the Sandy Fire ran and the Santa Susana foothills put homes in the wildland-urban interface. The caveat this whole article makes applies here too: the score is computed for your parcel, not the ZIP, so two homes in the same ZIP can land in different tiers.
| ZIP code | Community | Why it is on the map |
|---|---|---|
| 93065 | Simi Valley | Sandy Fire (2026) started near Rudolph Drive on the south edge |
| 93063 | Simi Valley | North and east foothills, Santa Susana Mountains WUI |
| 93021 | Moorpark | Chaparral WUI on the west side of the valley |
| 91311 | Chatsworth | Santa Susana WUI across the Los Angeles county line |
| 91307 | West Hills | Bell Canyon and west-valley WUI, on the evacuation-order side |
[Get a Satelife wildfire-risk report for your address](https://app.satelife.ai/)
## Behind the numbers
Every figure and chart in this article is drawn from real Satelife wildfire-risk reports generated for these exact Simi Valley addresses — the same multi-layer assessment Satelife runs for any property.
Want the score for your own address? [Get a Satelife wildfire-risk report](https://app.satelife.ai/). Satelife is explainable, multi-layer, address-level decision support — it is not a substitute for official evacuation orders or an insurer's underwriting judgement.
---
*Sources: [CAL FIRE — Sandy Fire incident](https://www.fire.ca.gov/incidents/2026/5/18/sandy-fire); [Sandy Fire](https://en.wikipedia.org/wiki/Sandy_Fire), [Easy Fire](https://en.wikipedia.org/wiki/Easy_Fire), [Simi Fire](https://en.wikipedia.org/wiki/Simi_Fire), and [Topanga Fire](https://en.wikipedia.org/wiki/Topanga_Fire) (Wikipedia); [FEMA National Risk Index](https://hazards.fema.gov/nri/). Fire photographs via Wikimedia Commons as credited.*